All posts
-
🔗Colorado: Hex Plots, API packages, and R
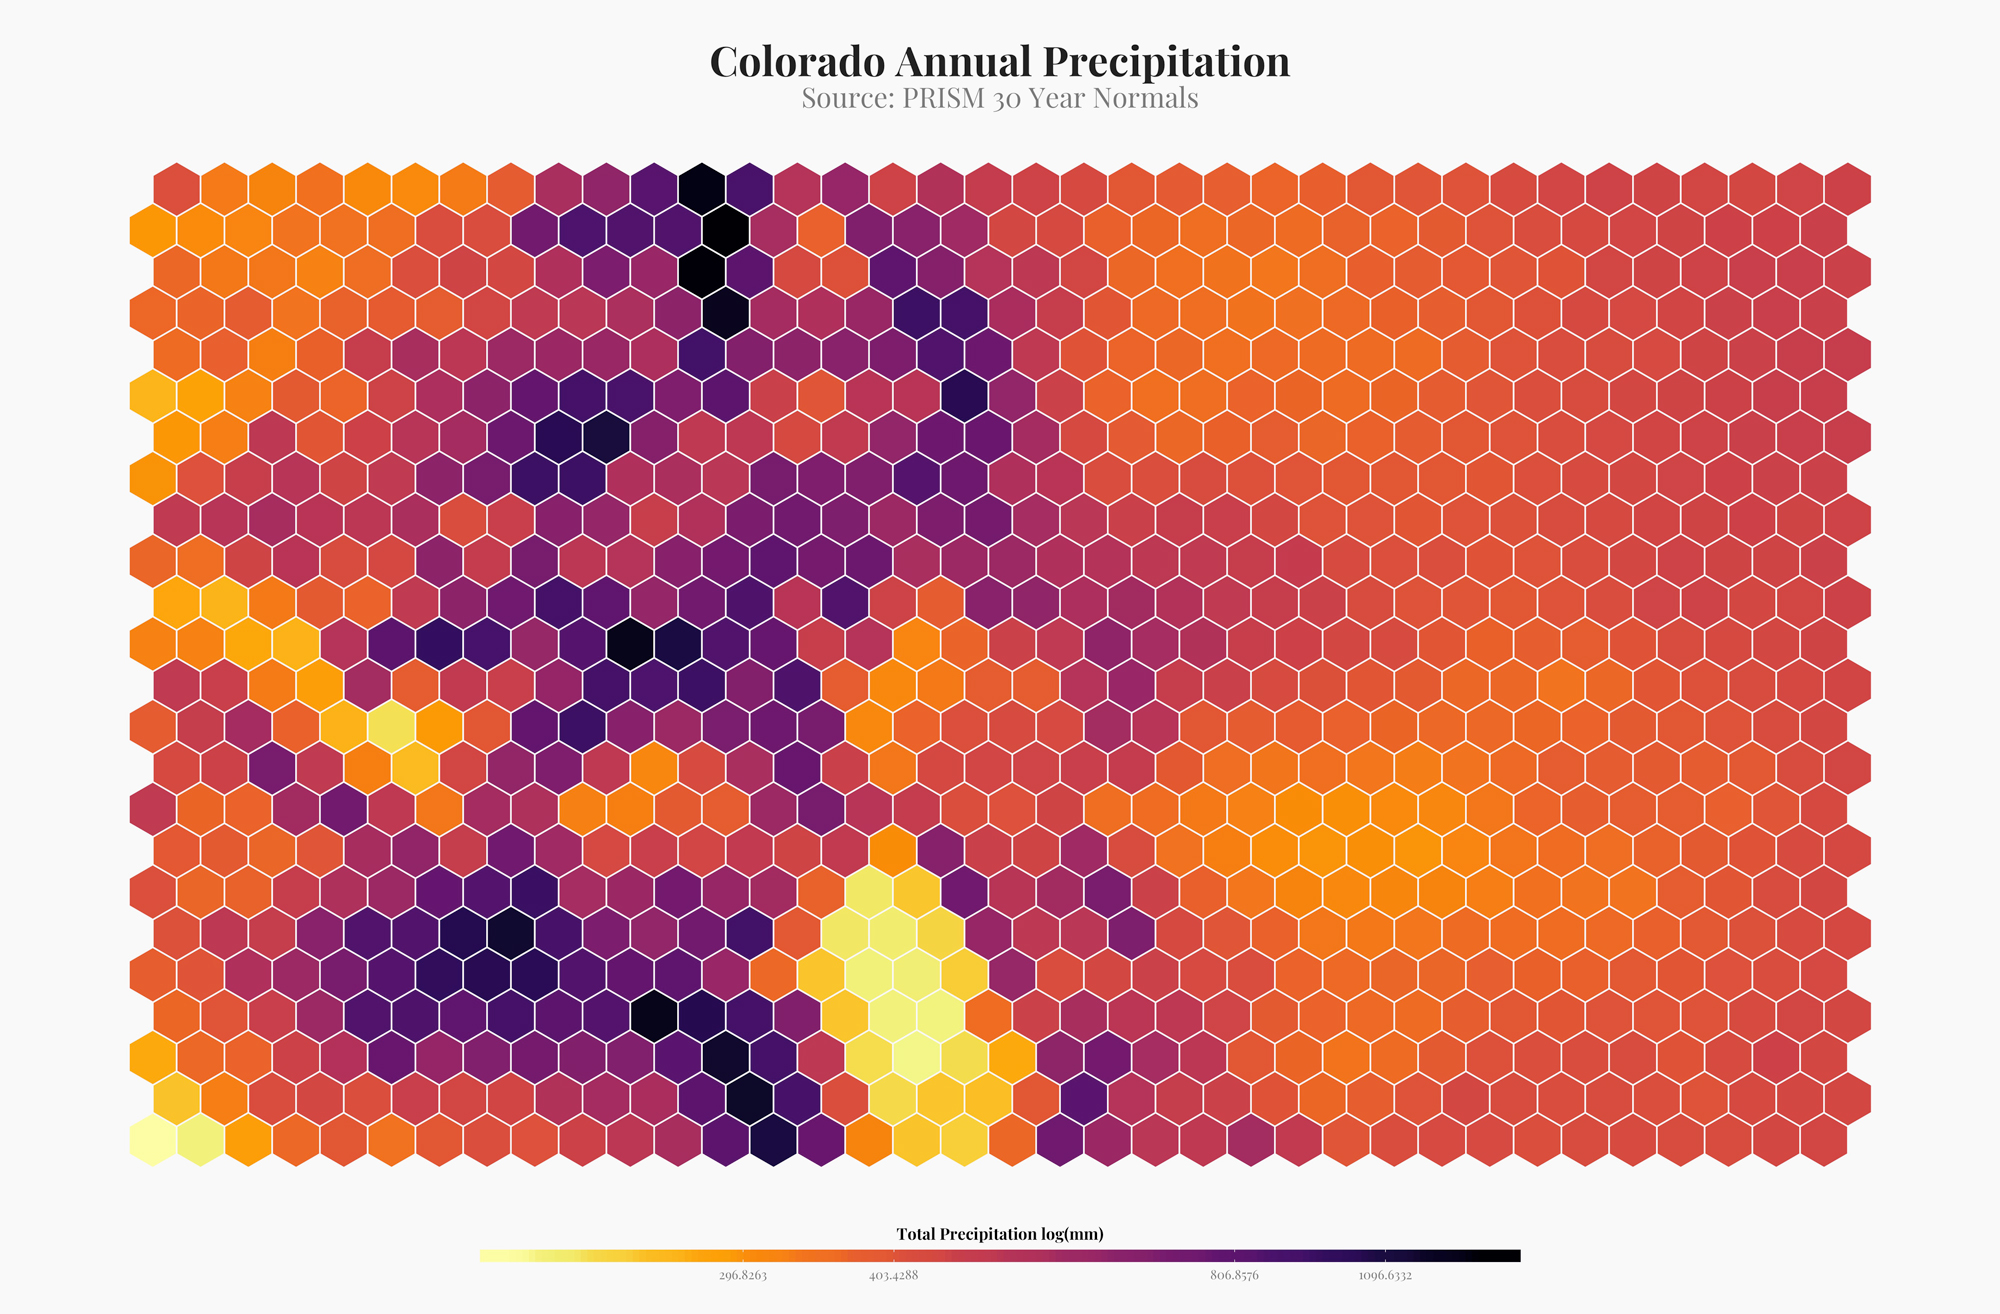
I've been seeing a lot of hex plots made with r. They are a way to semi-artistically visualize spatial data. Although I don't think this is completely appropriate for most visualizations, it looks amazing. Here are a few examples of how I made hex plots in R.
-
🔗Spatially Balanced Sample Designs in R with `spsurvey::grts()`
We've been using spatially balanced stratified study designs more frequently at work these days. They are a good way to make probabilistic inference over large areas. A popular method of creating these designs is using the R function
spsurvey::grts(). The following is a basic (very basic) explainer of how to get up and running withgrts()function and what it is. But a bit about GRTS and spatially balanced study design before we get coding. -
🔗Statistics in R: Resources for Understanding Statistics in R
This is a collections of resources that have helped me learn and understand statistics in R.
-
🔗Kernel Density Estimation in R
For a recent project I needed to run a kernel density estimation in R, turning GPS points into a raster of point densities. Below is how I accomplished that.
-
🔗Helpful Wordpress Snippets
Some helpful Wordpress snippets that I am always looking up.
-
🔗Cumulative Distribution Function
Cumulative distribution functions allow you to answer the questions, what percent of my sample is less than or greater than a value. For example I work with sage-brush cover frequently. With a cumulative distribution function I can answer the question, what proportion of my plots with sagebrush have greater than 90% cover.