#ggplot
-
🔗Wildfires in the West
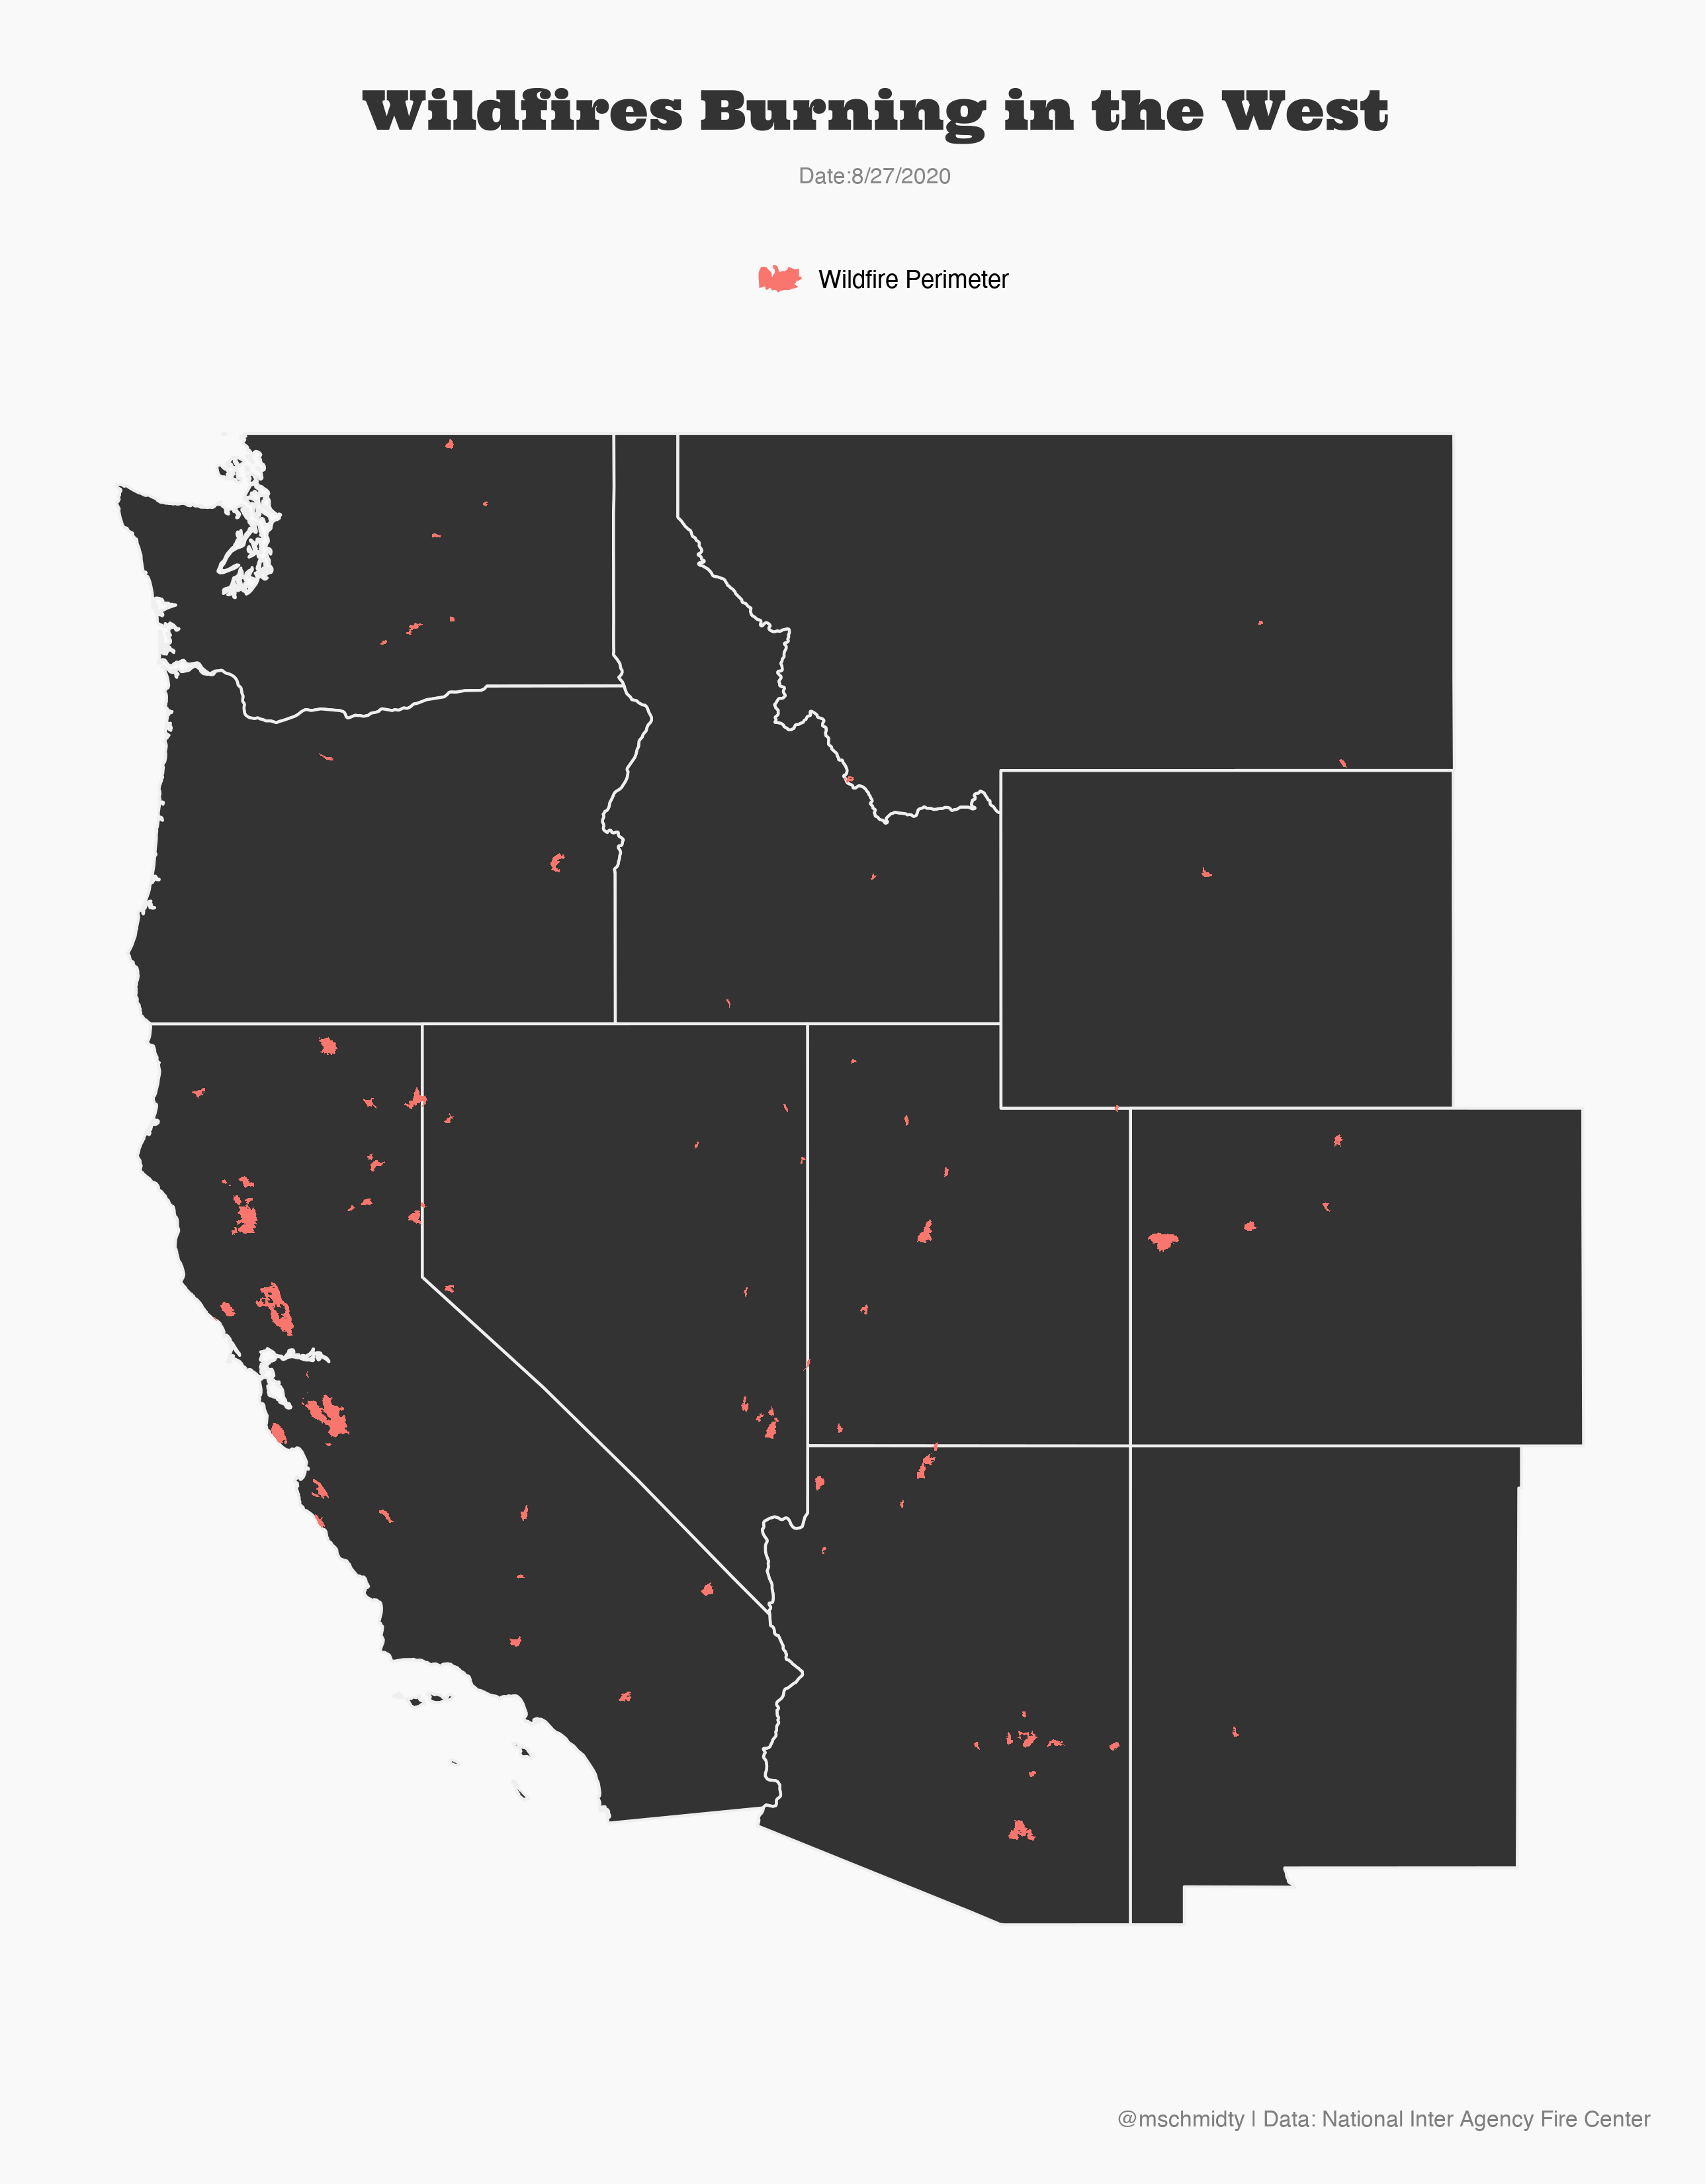
The second largest fire in Colorado's History is currently burning. California is also having a historic fire season.
-
🔗#30daymapchallange Day 1 Points
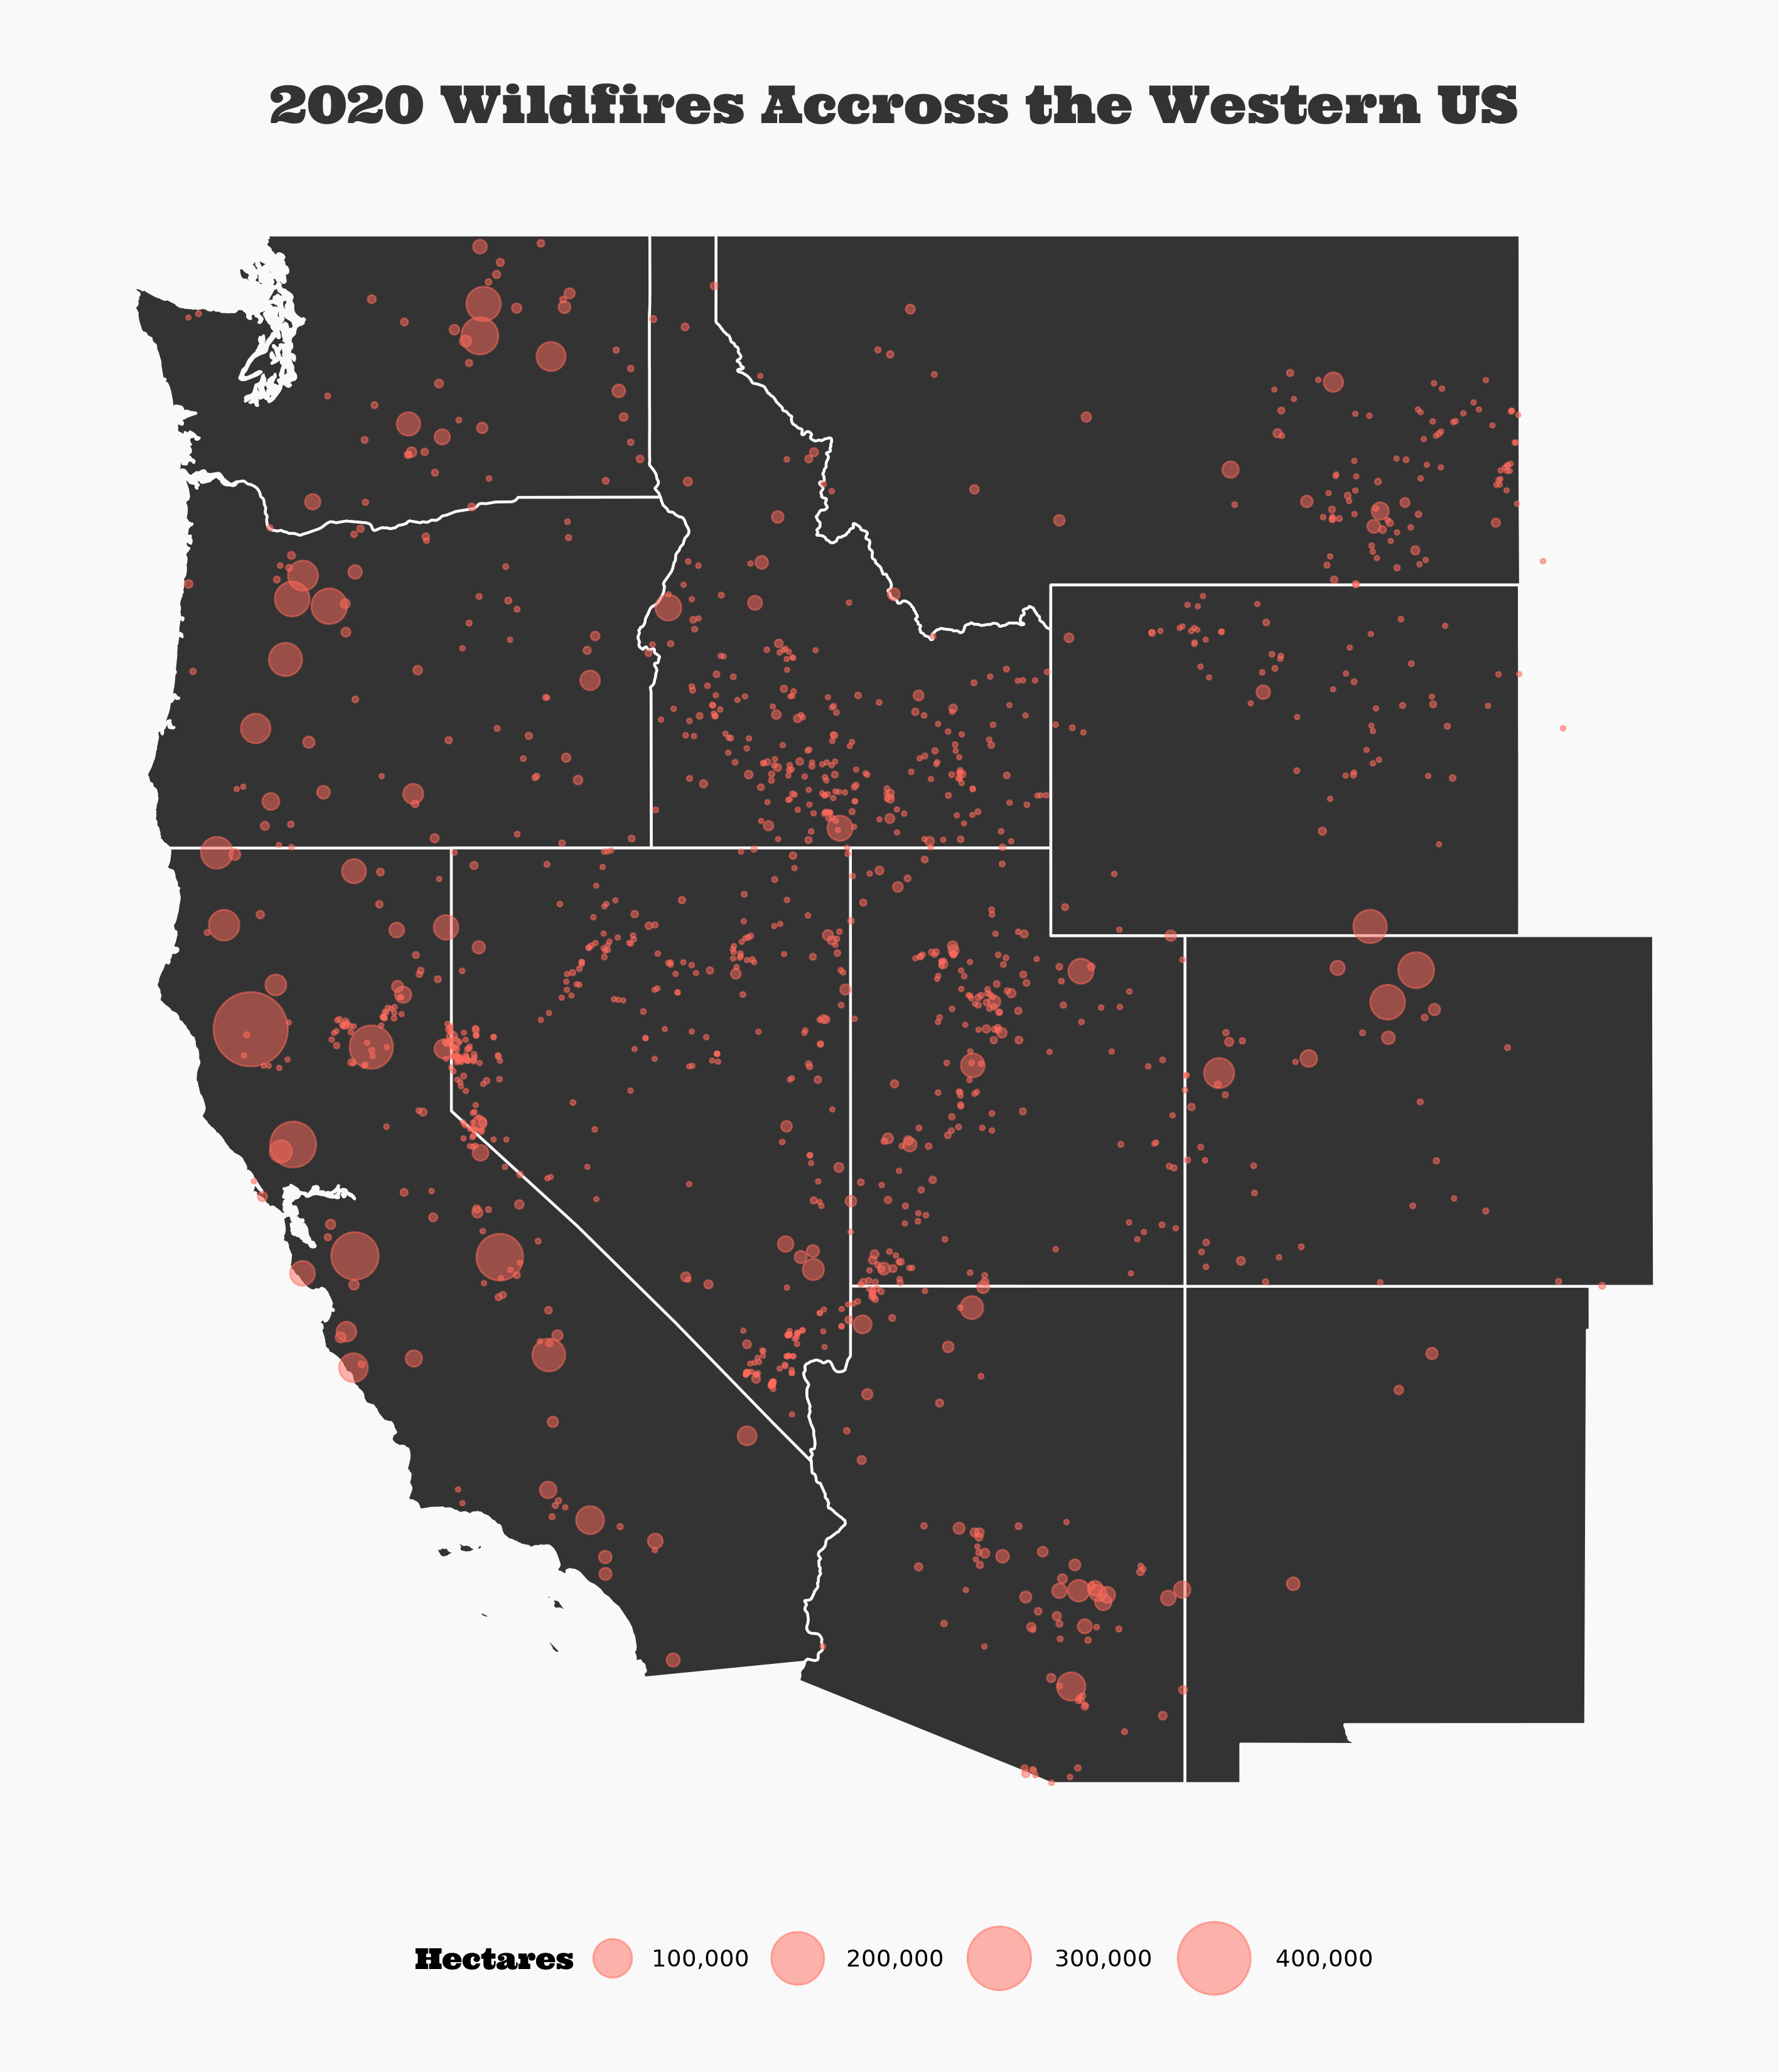
I'm starting the #30daymapchallange Points prompt by continuing my obsession with the current fire season. Here are all the fires from 2020 mapped as points. What a year.
-
🔗#30daymapchallange Day Green
For the seventh day of the #30daymapchallange, I made a map using Open Street Map Data to map my old neighborhood. I feel lucky to have grown up near mountains in a city.
-
🔗TidyTuesday: Energy Usage in Europe
I haven't had a ton of time lately. On a recent road trip, I tried out a Tidy Tuesday submission on European evergy usage. Because I didn't have enough time, I wanted to make something simple and work on making it really easy to read. I think I did that. I would have liked to do a bit more with the theme. Maybe next time.
-
🔗Will There be a Raftable Release out of McPhee Reservoir
I live next to the Dolores River. It’s an often overlooked gem of the southwest. It runs from just outside Rico, Colorado at its headwaters to the Colorado River near Moab, Utah. Rafting it is an experience.
-
🔗Colorado: Hex Plots, API packages, and R
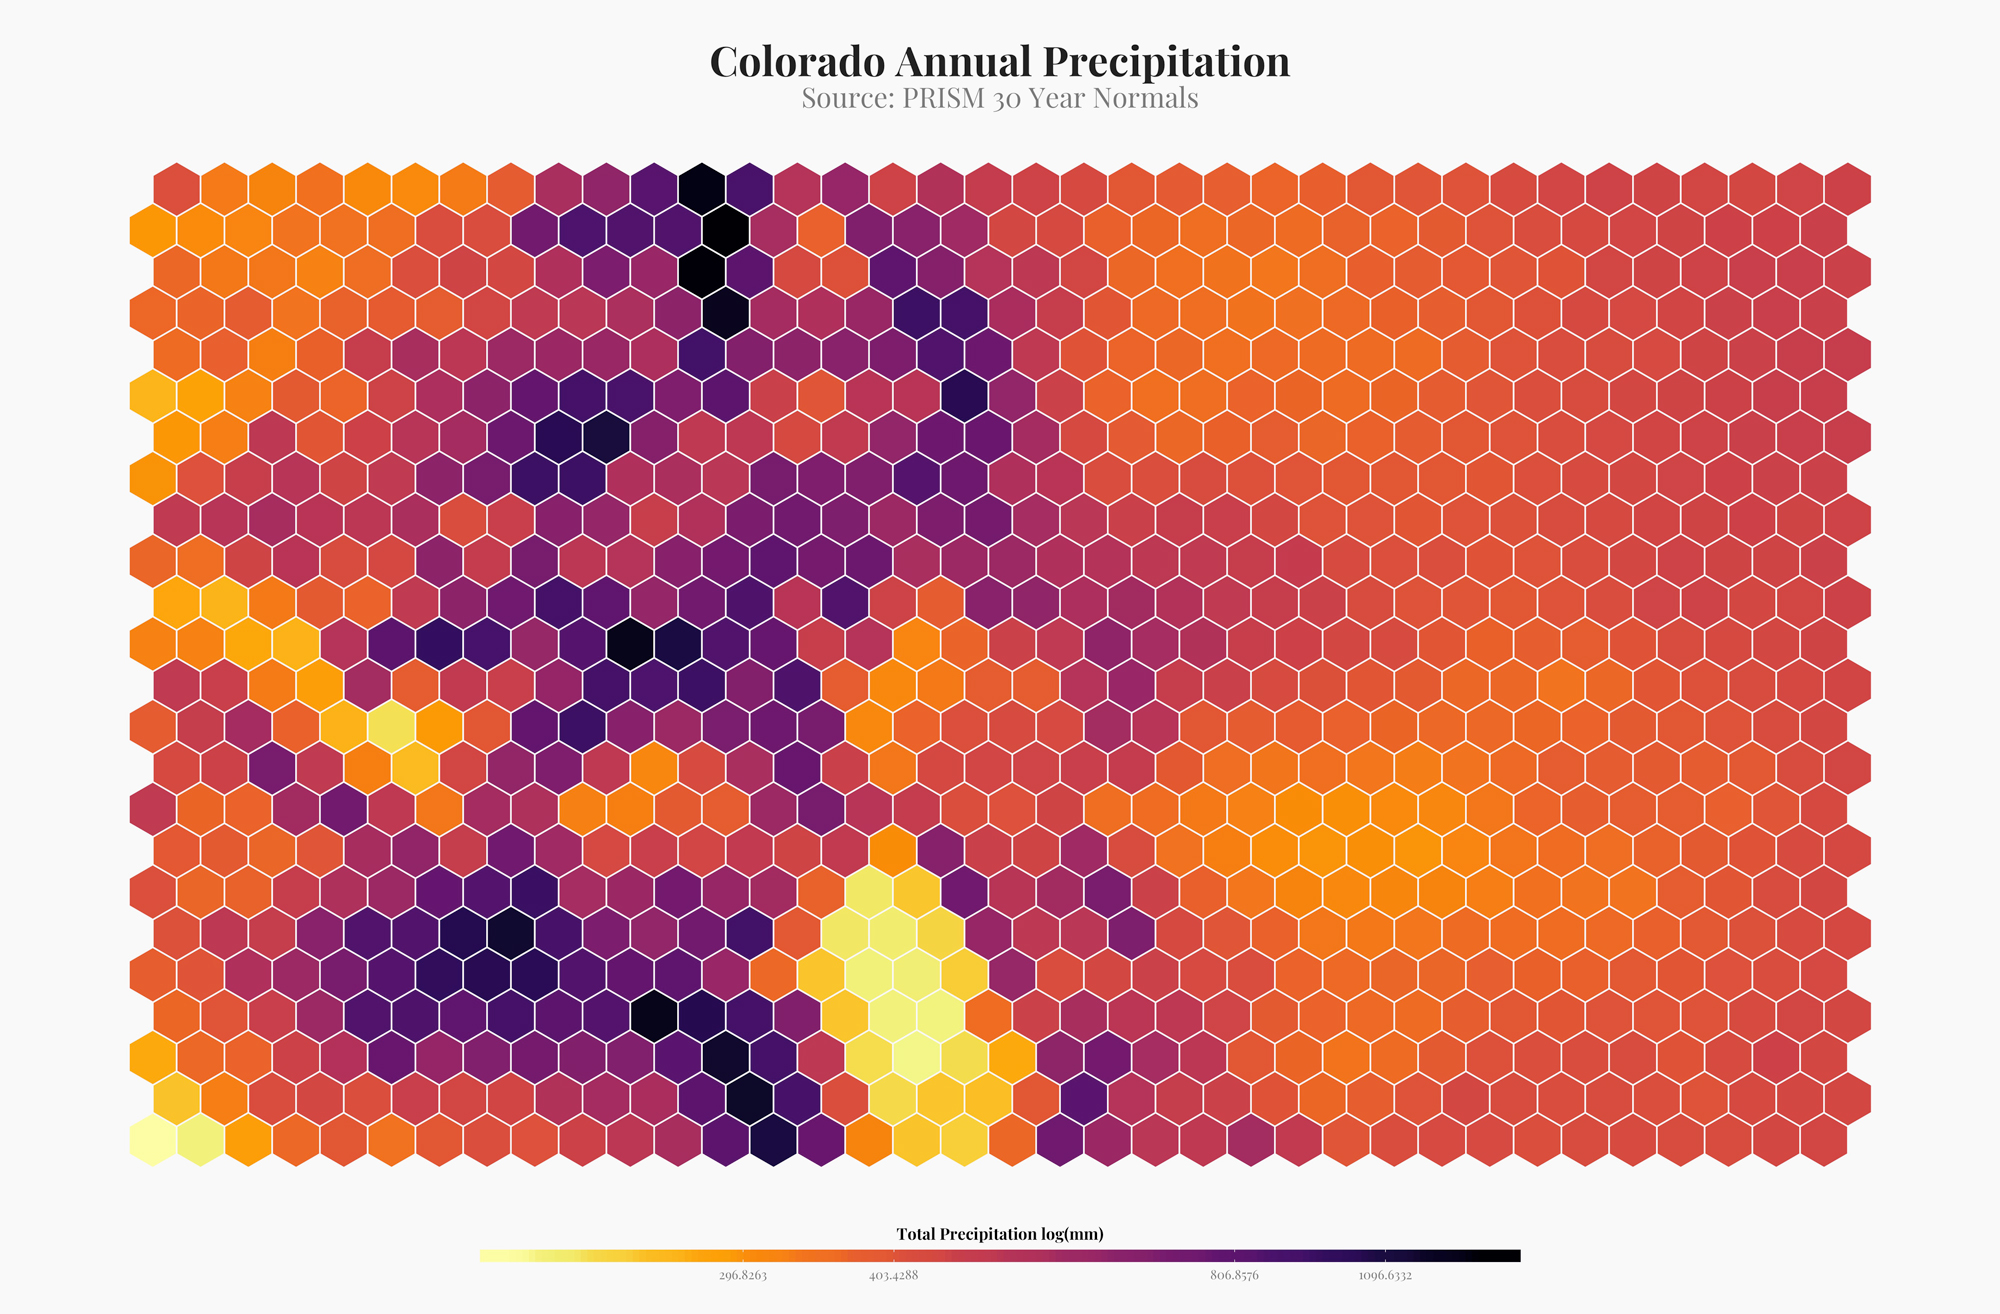
I've been seeing a lot of hex plots made with r. They are a way to semi-artistically visualize spatial data. Although I don't think this is completely appropriate for most visualizations, it looks amazing. Here are a few examples of how I made hex plots in R.
See all tags.