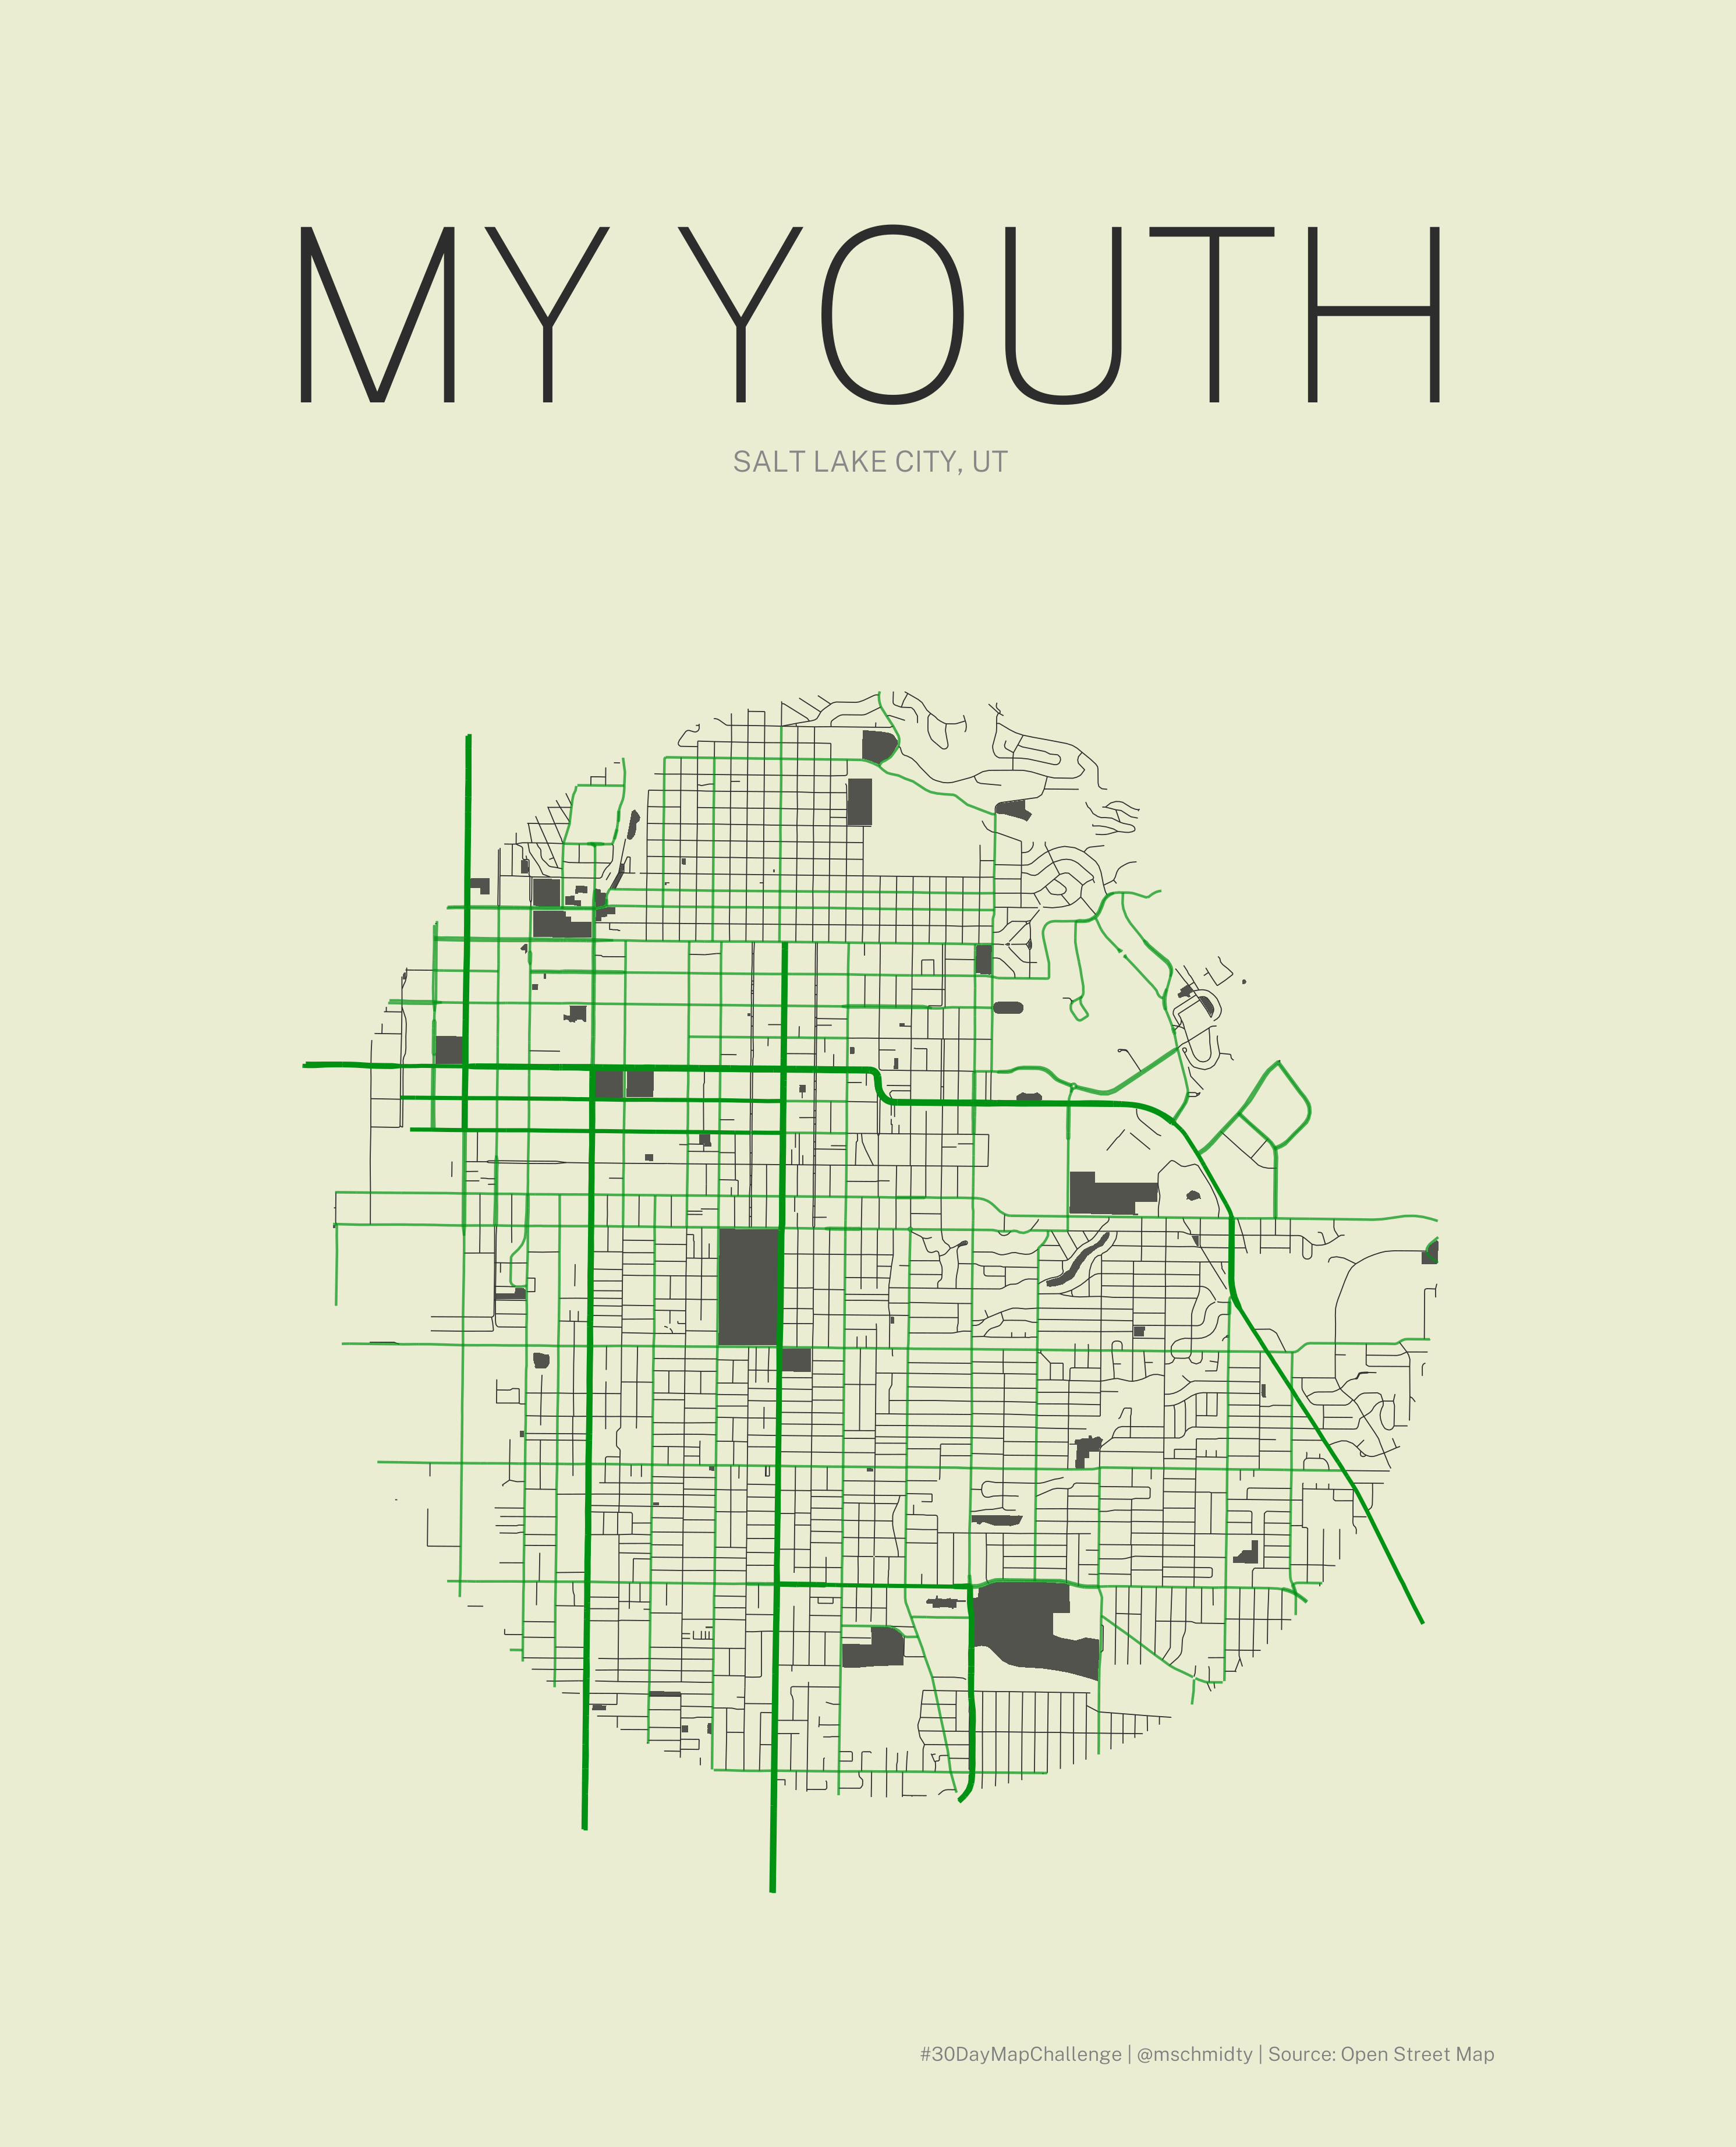
#30daymapchallange Day Green
For the seventh day of the #30daymapchallange, I made a map using Open Street Map Data to map my old neighborhood. I feel lucky to have grown up near mountains in a city.
Here are my scripts. I have included two versions. One is with a logo, trying to make it look pretty with just R. The second is me giving up and using Adobe Illustrator to add the title.
# Set Up and Load Libraries
library(osmdata)
library(tidyverse)
library(sf)
library(schmidtytheme)

theme_set(theme_schmidt()+
            theme(
              text=element_text(family="Public Sans Light")
            ))

#Explore the OSM data
available_features()
available_tags("natural")


# Query each Layer
q <- getbb("Salt Lake City") %>%
  opq() %>%
  add_osm_feature("leisure", "park")

q2<- opq("Salt Lake City")%>%
  add_osm_feature("highway", c("residential", "services"))

q3<- getbb("Salt Lake City")%>%
  opq()%>%
  add_osm_feature("highway", c("secondary", "tertiary"))

q4<- opq("Salt Lake City")%>%
  add_osm_feature("highway", c("primary"))

# Convert Each layer into a sf object and reproject
parks_sf <- osmdata_sf(q)$osm_polygons%>%
  st_transform("+proj=utm +zone=12 +ellps=GRS80 +datum=NAD83")

residential_sf<-osmdata_sf(q2)$osm_lines%>%
  st_transform("+proj=utm +zone=12 +ellps=GRS80 +datum=NAD83")

tertiary_sf<-osmdata_sf(q3)$osm_lines%>%
  st_transform("+proj=utm +zone=12 +ellps=GRS80 +datum=NAD83")

primary_sf<-osmdata_sf(q4)$osm_lines%>%
  st_transform("+proj=utm +zone=12 +ellps=GRS80 +datum=NAD83")

## Create buffers of my old neighborhood and clip each layer
street<-tibble(
  place = c("Salt Lake City"),
  lat = c(40.7487517),
  lon = c(-111.861731)
)%>%
  st_as_sf(coords = c("lon", "lat"), crs = 4326)%>%
  st_transform("+proj=utm +zone=12 +ellps=GRS80 +datum=NAD83")

hood<-street%>%
  st_buffer(4200)

hood_plus<-street%>%
  st_buffer(5000)

parks<-parks_sf%>%
  st_intersection(hood)

residential <- residential_sf%>%
  st_intersection(hood)

tertiary<-tertiary_sf%>%
  st_intersection(hood)

primary<-primary_sf%>%
  st_intersection(hood_plus)

#Plot
background_color <- "#EAEDD2"

ggplot()+
  geom_sf(data = parks, color = "transparent", fill = "#2D2D2D", alpha = 0.8)+
  geom_sf(data = residential, color = "#2D2D2D", size=0.2)+
  geom_sf(data = tertiary, color = "#019214", alpha = 0.7)+
  geom_sf(data = primary, color = "#019214", size = 0.8)+
  ##geom_sf(data = hood, fill = "transparent", color = "#ffffff", size = 0.5)+
  labs(
    title = "MY YOUTH",
    subtitle = "SALT LAKE CITY, UT",
    caption = "#30DayMapChallenge | @mschmidty | Source: Open Street Map"
  )+
  coord_sf()+theme(
    plot.title = element_text(family = "Public Sans Thin", size = 100, color = "#2D2D2D", margin=margin(0,0,0,0)),
    plot.subtitle = element_text(family = "Public Sans Light", face = "plain",margin=margin(10,0,65,0), size = 12),
    plot.caption = element_text(hjust = 1, margin=margin(35,0,0,0)),
    panel.grid.major = element_line(color="transparent"),
    panel.background = element_rect(fill = background_color, color = "transparent"),
    plot.background = element_rect(fill = background_color, color = "transparent"),
    axis.text = element_blank(),
    plot.margin = unit(c(85, 100, 35, 100), "pt")
  )+
  ggsave("output/07-green-my-neighborhood.png", type="cairo")


#Version 2 - Using AI for Text and different crop.
primary<-primary_sf%>%
  st_intersection(hood_plus)

ggplot()+
  geom_sf(data = parks, color = "transparent", fill = "#2D2D2D", alpha = 0.8)+
  geom_sf(data = residential, color = "#2D2D2D", size=0.2)+
  geom_sf(data = tertiary, color = "#019214", alpha = 0.7)+
  geom_sf(data = primary, color = "#019214", size = 0.8)+
  coord_sf()+theme(
    plot.title = element_text(family = "Public Sans Thin", size = 100, color = "#2D2D2D", margin=margin(0,0,0,0)),
    plot.subtitle = element_text(family = "Public Sans Light", face = "plain",margin=margin(10,0,65,0), size = 12),
    plot.caption = element_text(hjust = 1, margin=margin(35,0,0,0)),
    panel.grid.major = element_line(color="transparent"),
    panel.background = element_rect(fill = background_color, color = "transparent"),
    plot.background = element_rect(fill = background_color, color = "transparent"),
    axis.text = element_blank(),
    plot.margin = unit(c(85, 100, 35, 100), "pt")
  )+ggsave("output/07-green-my-neighborhoodV2.png", type="cairo")