TidyTuesday: Energy Usage in Europe
I haven't had a ton of time lately. On a recent road trip, I tried out a Tidy Tuesday submission on European evergy usage. Because I didn't have enough time, I wanted to make something simple and work on making it really easy to read. I think I did that. I would have liked to do a bit more with the theme. Maybe next time.
I was inspired by @MaiaPelletier and her circular version using the same data - which is amazing.
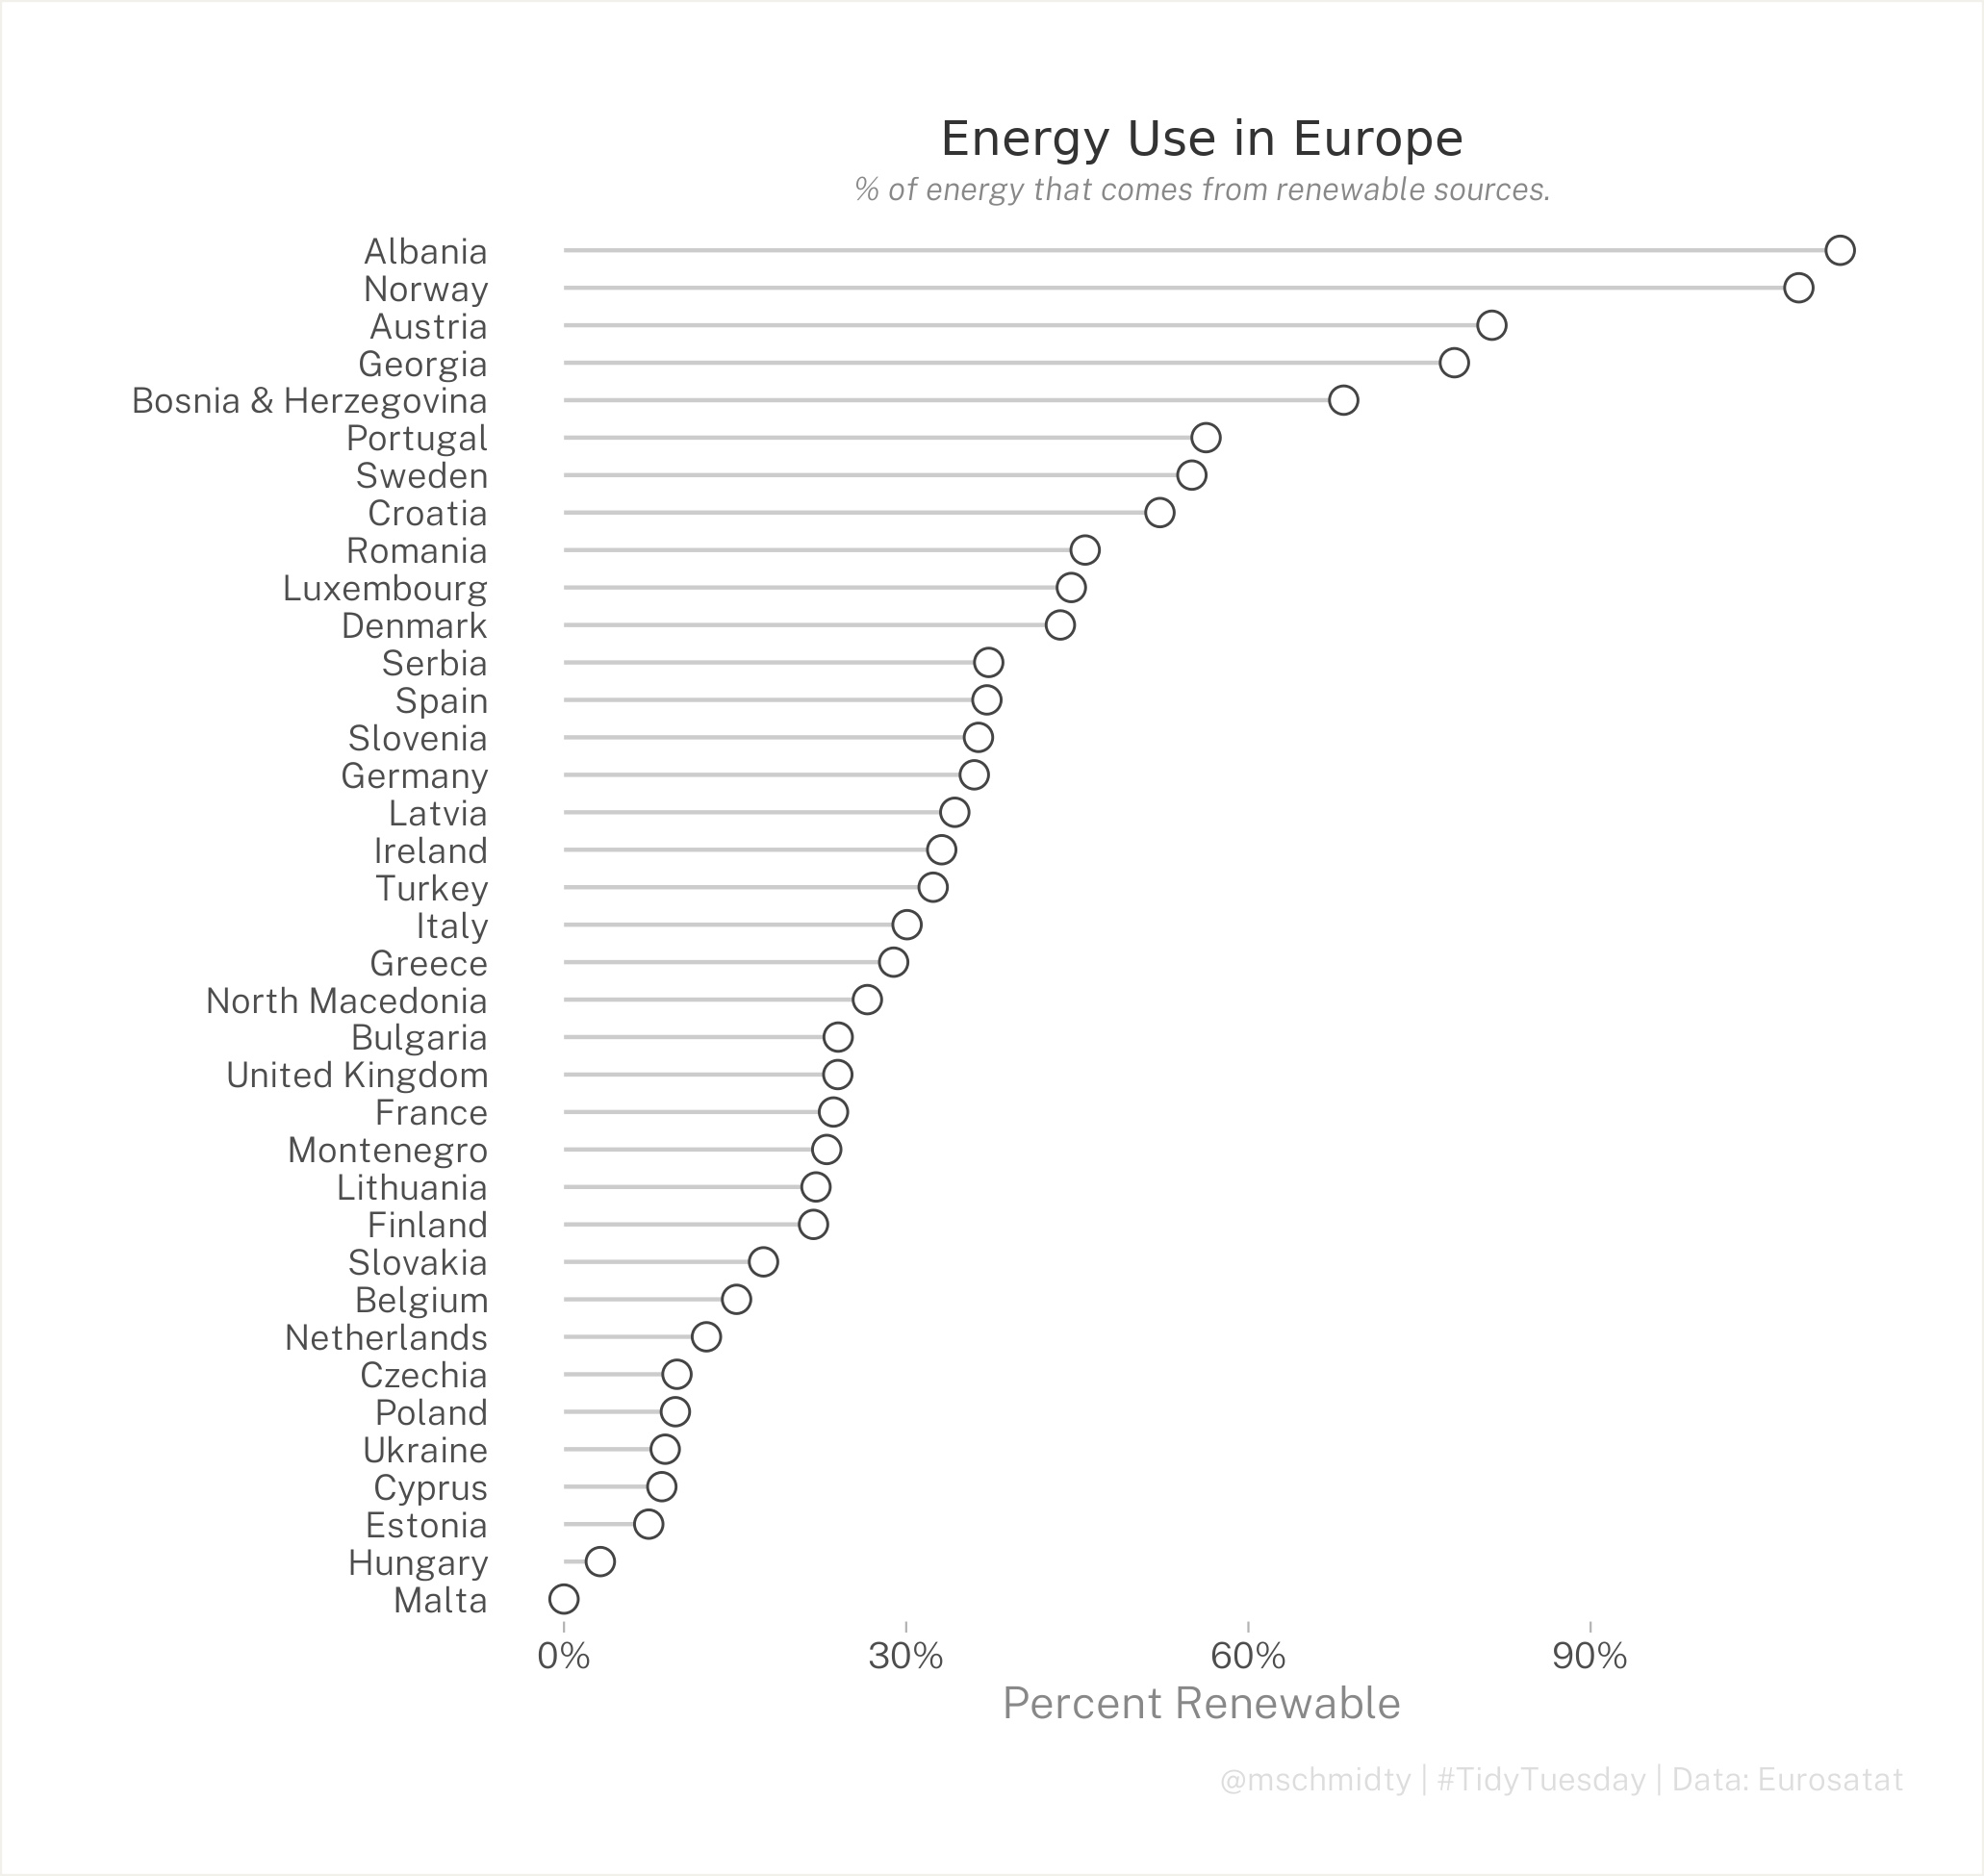
The final product:
And the scripts:
library(tidytuesdayR)
library(tidyverse)
library(here)
extrafont::loadfonts()

theme_set(theme_light()+
            theme(
              text=element_text(family="Public Sans Light")
            ))

energy_data <- tidytuesdayR::tt_load('2020-08-04')

energy_types <- energy_data$energy_types
country_totals <- energy_data$country_totals

country_totals%>%
  count(level)

total_energy<-country_totals%>%
  select(-`2017`, -`2016`, -level)%>%
  pivot_wider(names_from=type, values_from=`2018`)%>%
  janitor::clean_names()%>%
  mutate(total_energy_use = total_net_production+imports-exports-energy_absorbed_by_pumping)%>%
  select(country, total_energy_use)

percent_renewable<-energy_types%>%
  select(-`2016`, -`2017`, -`level`)%>%
  pivot_wider(names_from=type, values_from=`2018`)%>%
  janitor::clean_names()%>%
  mutate(
    renewable=hydro+wind+solar+geothermal+pumped_hydro_power,
    non_renewable = conventional_thermal+nuclear+other,
    percent_renewable = renewable/(renewable+non_renewable)
    )%>%
  left_join(total_energy)%>%
  mutate(
    country_name=ifelse(is.na(country_name), "United Kingdom", country_name),
    other_percent_renewable = renewable/total_energy_use)

View(percent_renewable)

percent_renewable%>%
  mutate(country_name=fct_reorder(country_name, other_percent_renewable))%>%
  ggplot(aes(country_name, other_percent_renewable))+
  geom_segment( aes(x=country_name, xend=country_name, y=0, yend=other_percent_renewable), color="#CCCCCC") +
  geom_point( color="#444444", size=3, shape=21, fill="#ffffff") +
  coord_flip()+
  theme(
    plot.margin = margin(20, 20, 20, 20),
    plot.background = element_rect(color="#F2F0EA"),
    panel.background = element_blank(),
    panel.grid.major.x = element_blank(),
    panel.grid.major.y = element_blank(),
    panel.grid.minor.x = element_blank(),
    panel.border = element_blank(),
    axis.line=element_blank(),
    axis.ticks.y = element_blank(),
    axis.text.x = element_text(size = 9),
    axis.text.y = element_text(margin = margin(t = 30)),
    axis.title = element_text(size=11, color="#888888"),
    plot.title = element_text(hjust = 0.5,
                              size = 12,
                              family="Public Sans Bold",
                              color="#333333",
                              margin = margin(10, 0, 3, 0)),
    plot.subtitle = element_text(hjust = 0.5,
                                size = 8,
                                color = "#888888",
                                face = "italic"),
    plot.caption = element_text(size=8,
                                color = "#dddddd",
                                margin = margin(10, 0, 0, 0))
  )+
  xlab("") +
  ylab("Percent Renewable")+
  labs(title="Energy Use in Europe",
       subtitle="% of energy that comes from renewable sources.",
       caption = "@mschmidty | #TidyTuesday | Data: Eurosatat")+ scale_y_continuous(labels = scales::percent)+

  ggsave(here("Dropbox", "r", "tidy_tuesday", "figures", "europe_energy_v1.png"), type='cairo', height=6.5)