#GIS
-
🔗Colorado: Hex Plots, API packages, and R
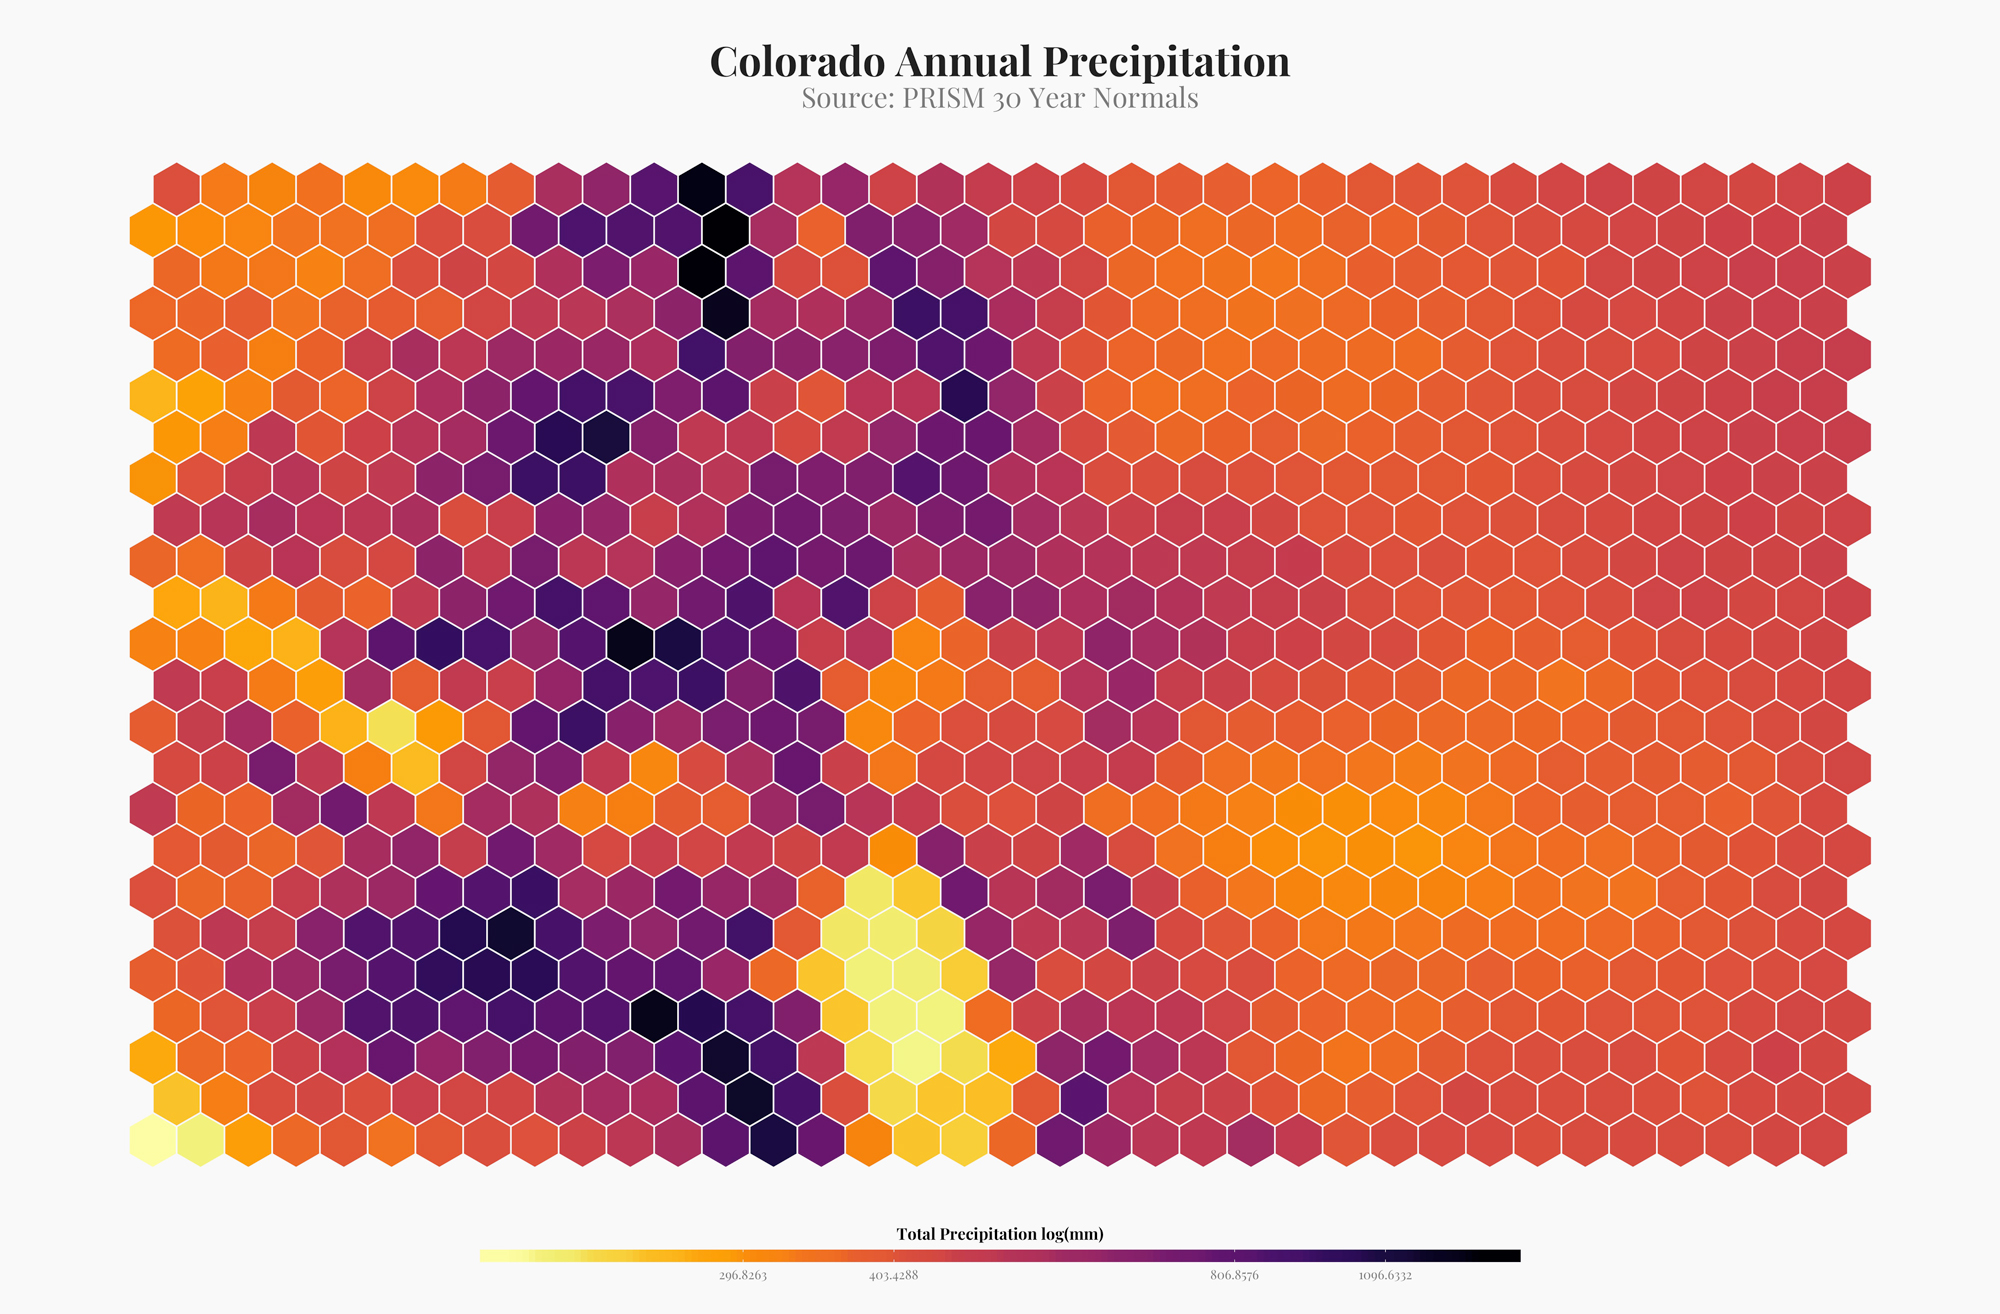
I've been seeing a lot of hex plots made with r. They are a way to semi-artistically visualize spatial data. Although I don't think this is completely appropriate for most visualizations, it looks amazing. Here are a few examples of how I made hex plots in R.
-
🔗Creating a polygon from scratch in R
A quick little snippet for making a polygon with coordinates out of thin air in r.
-
🔗Raster Distance Calculations
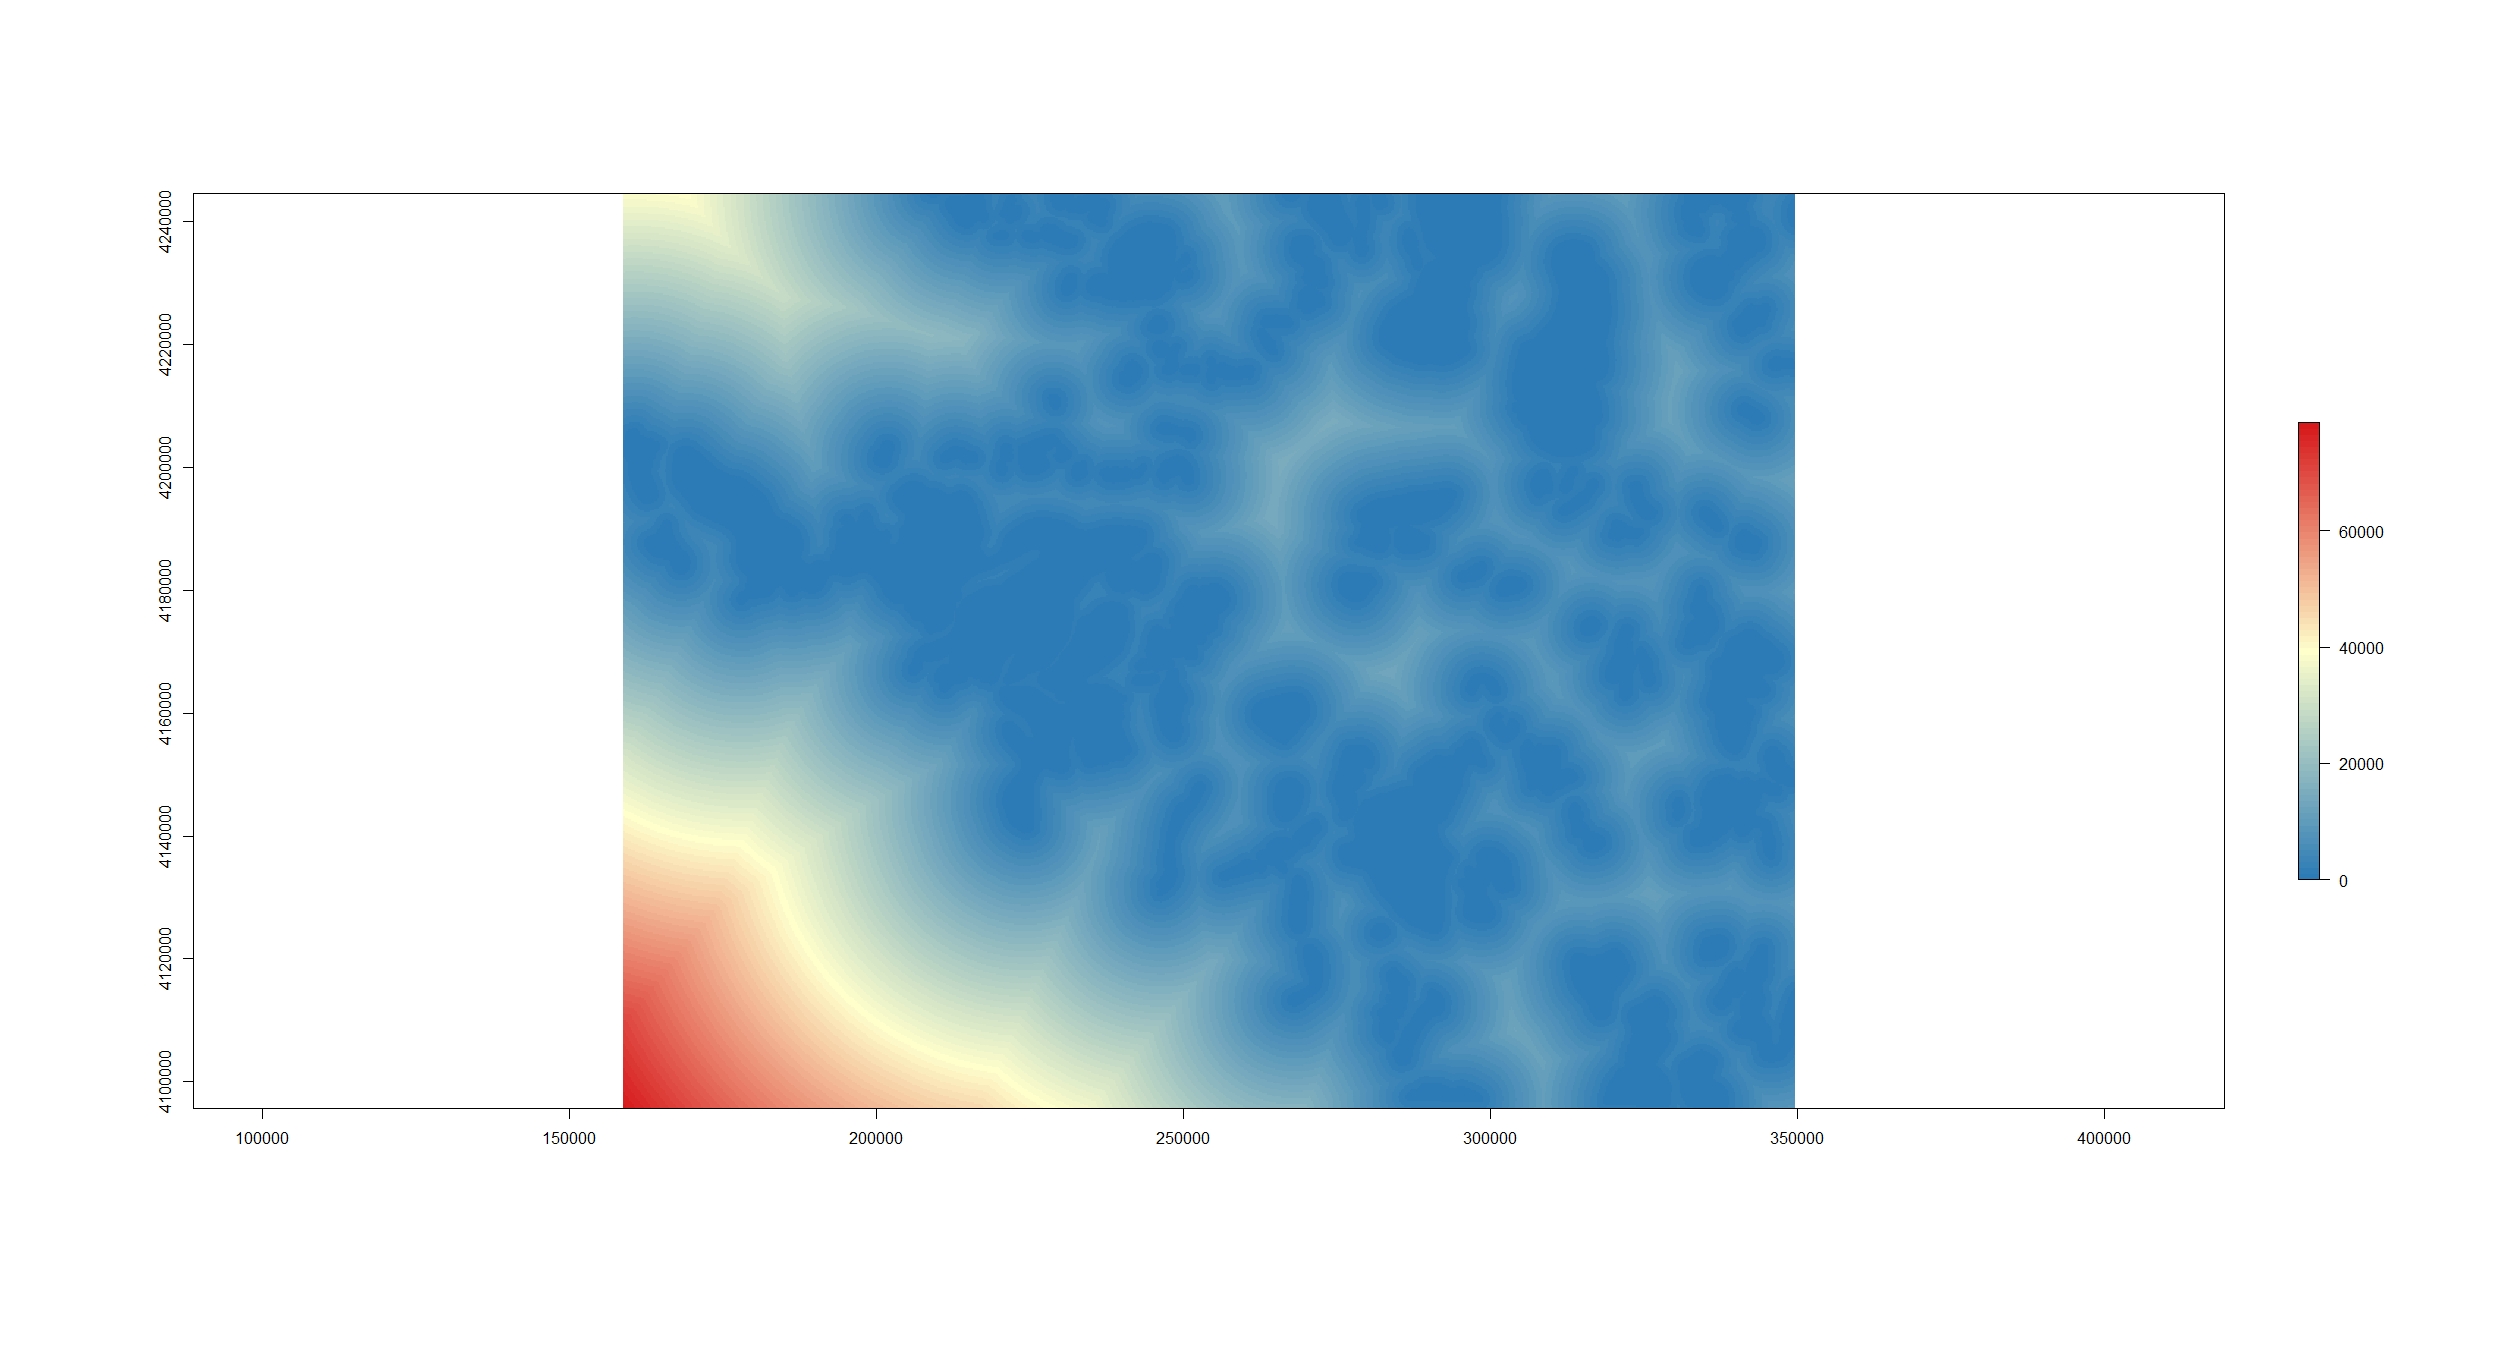
There are many cases when I have needed to calculate a distance from a point or many points to a feature in GIS. Until recently I have always used the near tool. This works really well for small datasets but can take forever with larger datasets. The near calculation also only works with points (I'm sure that there is a raster equivalent I just haven't done the research on it). I also really like to document where I got my data. You can do that in ArcGIS but it is an added step to do it.
-
🔗Classifying High Resolution Aerial Imagery - Part 2
I have been attempting to use random forests to classify high resolution aerial imagery. Part one of this post series was my first attempt. The aerial imagery dataset that I am working on is made up of many ortho tiles that I need to classify into vegetation categories. The first attempt was to classify vegetation on one tile. This note documents classifying vegetation across tiles.
-
🔗Making a Chloropleth Map in R
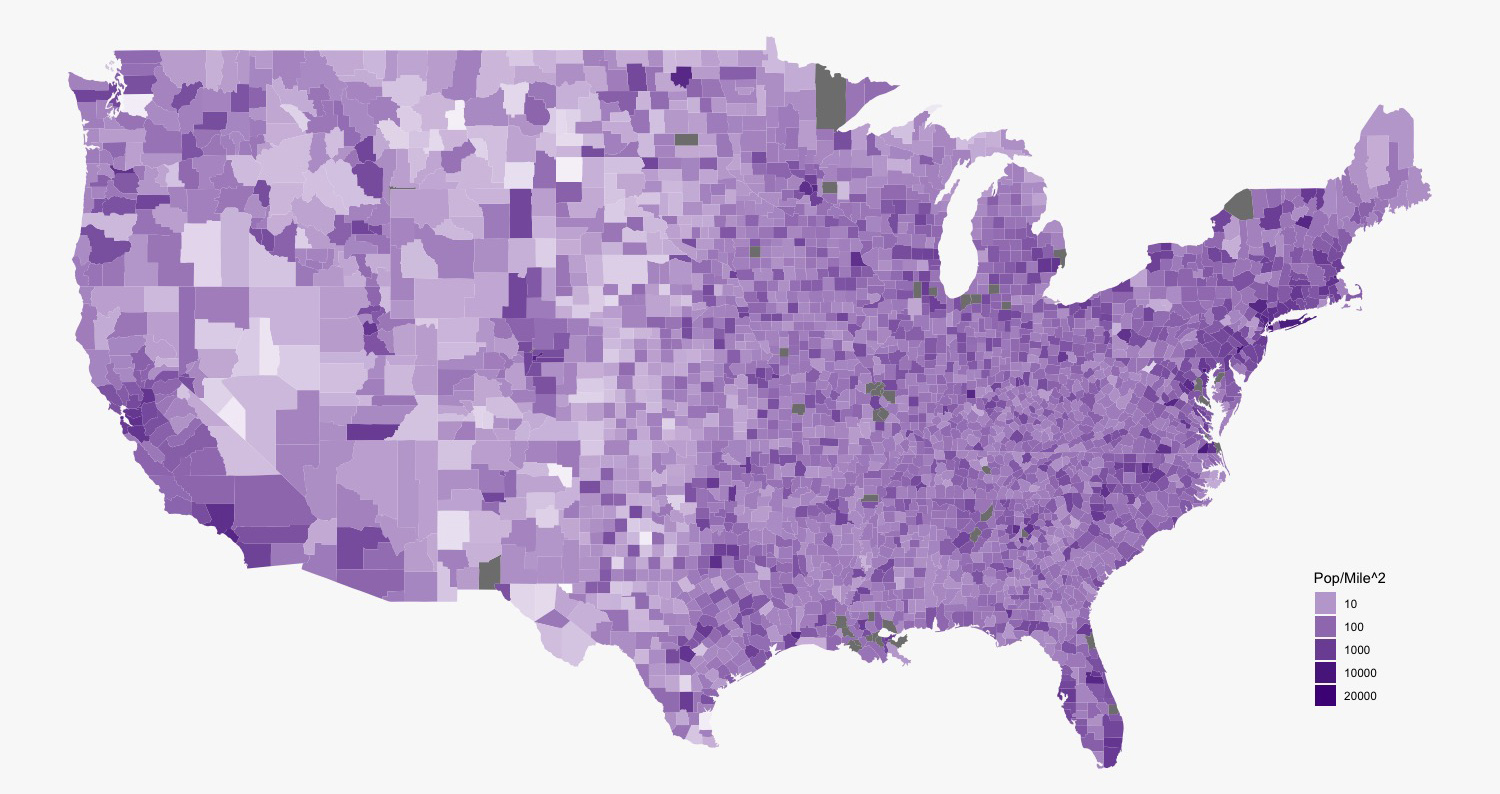
Load the libraries.
-
🔗Classifying High Resolution Aerial Imagery - Part 1
The following note documents a proof of concept for classifying vegetation with 4 band 0.1m aerial imagery. We used sagebrush, bare ground, grass, and PJ for classes. approximately 300 training polygons were used as a training data.
-
🔗Working with DIMA Tools and Making a Plant List from Species Richness Table
This is a series of notes that works with the DIMA database. The DIMA was produced by the Jornada Research Center for the Assessment Inventory and Monitoring framework.
-
🔗How to download and work with LSAT data - a better approach
My last post was about working with the r
getlandsatpackage to work with landsat data from NASA and the USGS. This post will be a brief refinement on that process. -
🔗Working With Landsat8 Data from the USGS
We are trying to monitor drought in sage-grouse habitat. Because we don't have historic on the ground data collection, I thought that it would be good to try and do this with landsat data. Landsat data is collected by the USGS and NASA about once ever 16 days.
-
🔗Landsat First Try
See all tags.