All posts
-
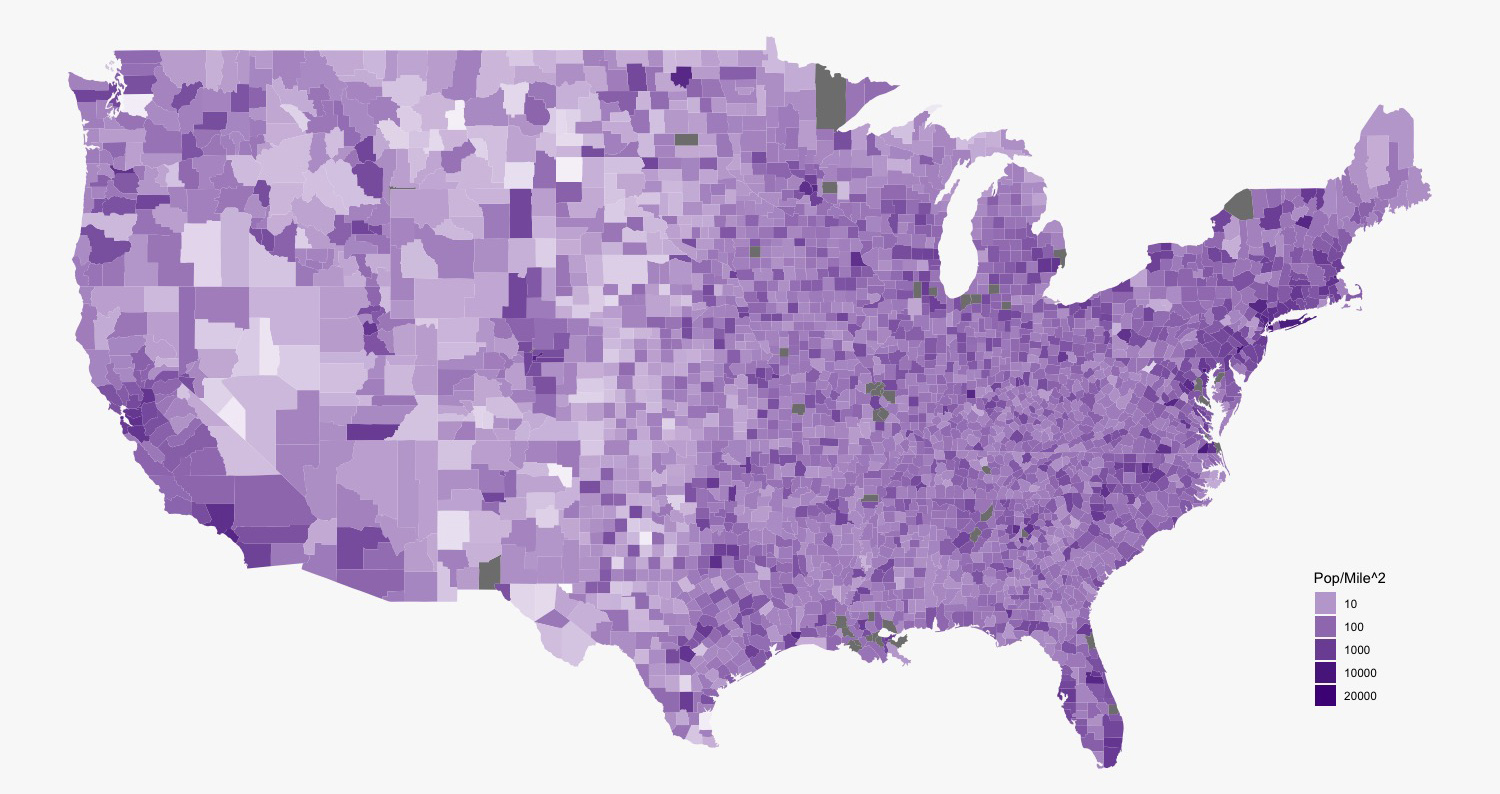
🔗Making a Chloropleth Map in R
Load the libraries.
-
🔗D3:Basic Line Chart
This is a basic line chart built with D3. I've written a few more tutorials on how to make charts starting out very basic and moving to a little more complex. I'm no expert, so these are how a beginner (at both javascript and D3) would explain everything. Some might find that methodology helpful. My previous tutorials: My first charts, SVG Plots, Scatterplot.
-
🔗D3.js: Basic ScatterPlot
I've made a few bar charts up to this point. But really what I want to do is plot data over time. We need to figure out how to add x and y axis and work with x and y coordinates. The next logical step then, is to make a scatterplot.
-
🔗D3.js Next Steps: SVG
So the next big steps in making charts is instead of using html elements, d3 works really well with svg elements. But even though svg elements are a flexible for making graphics, not that many people are familiar with them so they add another level of confusion to the process. So let's start at the beginning with what an svg element is.
-
🔗D3.js: Notes on my first outing
When I learned to program, I started to come up with all of these ideas that all of the sudden I knew were possible. But I didn't really know how to implement most of them. For instance, I've wanted to be able to use an API to retrieve data and then use that data to make a chart on the fly for quite some time. There's only one problem: I suck at javascript. Without a doubt, charting and making api calls on the front end requires javascript. It also means, working with D3 if you want to do it right. Needless to say, because I am not an excellent javascript (or anything but html, css, and a touch of r for that matter) this "dream" has been an uphill battle. Just getting the data has been a challenge. Needless to say, today I started working on some simple D3 charts. No longer will I wait until I magically become an amazing javascript developer to learn how to make charts.
-
🔗Vue and Axios
My notes on getting up and running with vue and axios. this is also the first step in turning my River Flow app which queries the USGS instantaneous flow data from a non server rendering non-route serving app to a Nuxt.js Universal Application (meaning it is rendered on the server before it is served).