Cumulative Distribution Function
Cumulative distribution functions allow you to answer the questions, what percent of my sample is less than or greater than a value. For example I work with sage-brush cover frequently. With a cumulative distribution function I can answer the question, what proportion of my plots with sagebrush have greater than 90% cover.
Example of how this is done.
library(dplyr)
rnorm(100, mean=0.20, sd=.07)%>%
  ecdf()%>%
  plot()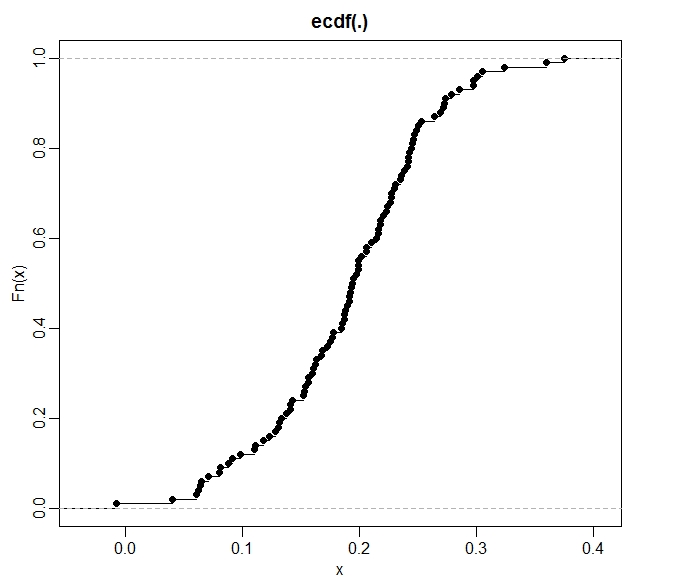
The x-axis shows the percent. The y-axis shows the proportion of observations.