Some AIM Data Visualizations from Work
I don't put a lot of what I do at work here. I try to keep work at work and a lot of what I post here is for fun. Lately though, I've been producing some visualizations from Assessment Inventory and Monitoring (AIM) data that I think are worth sharing.
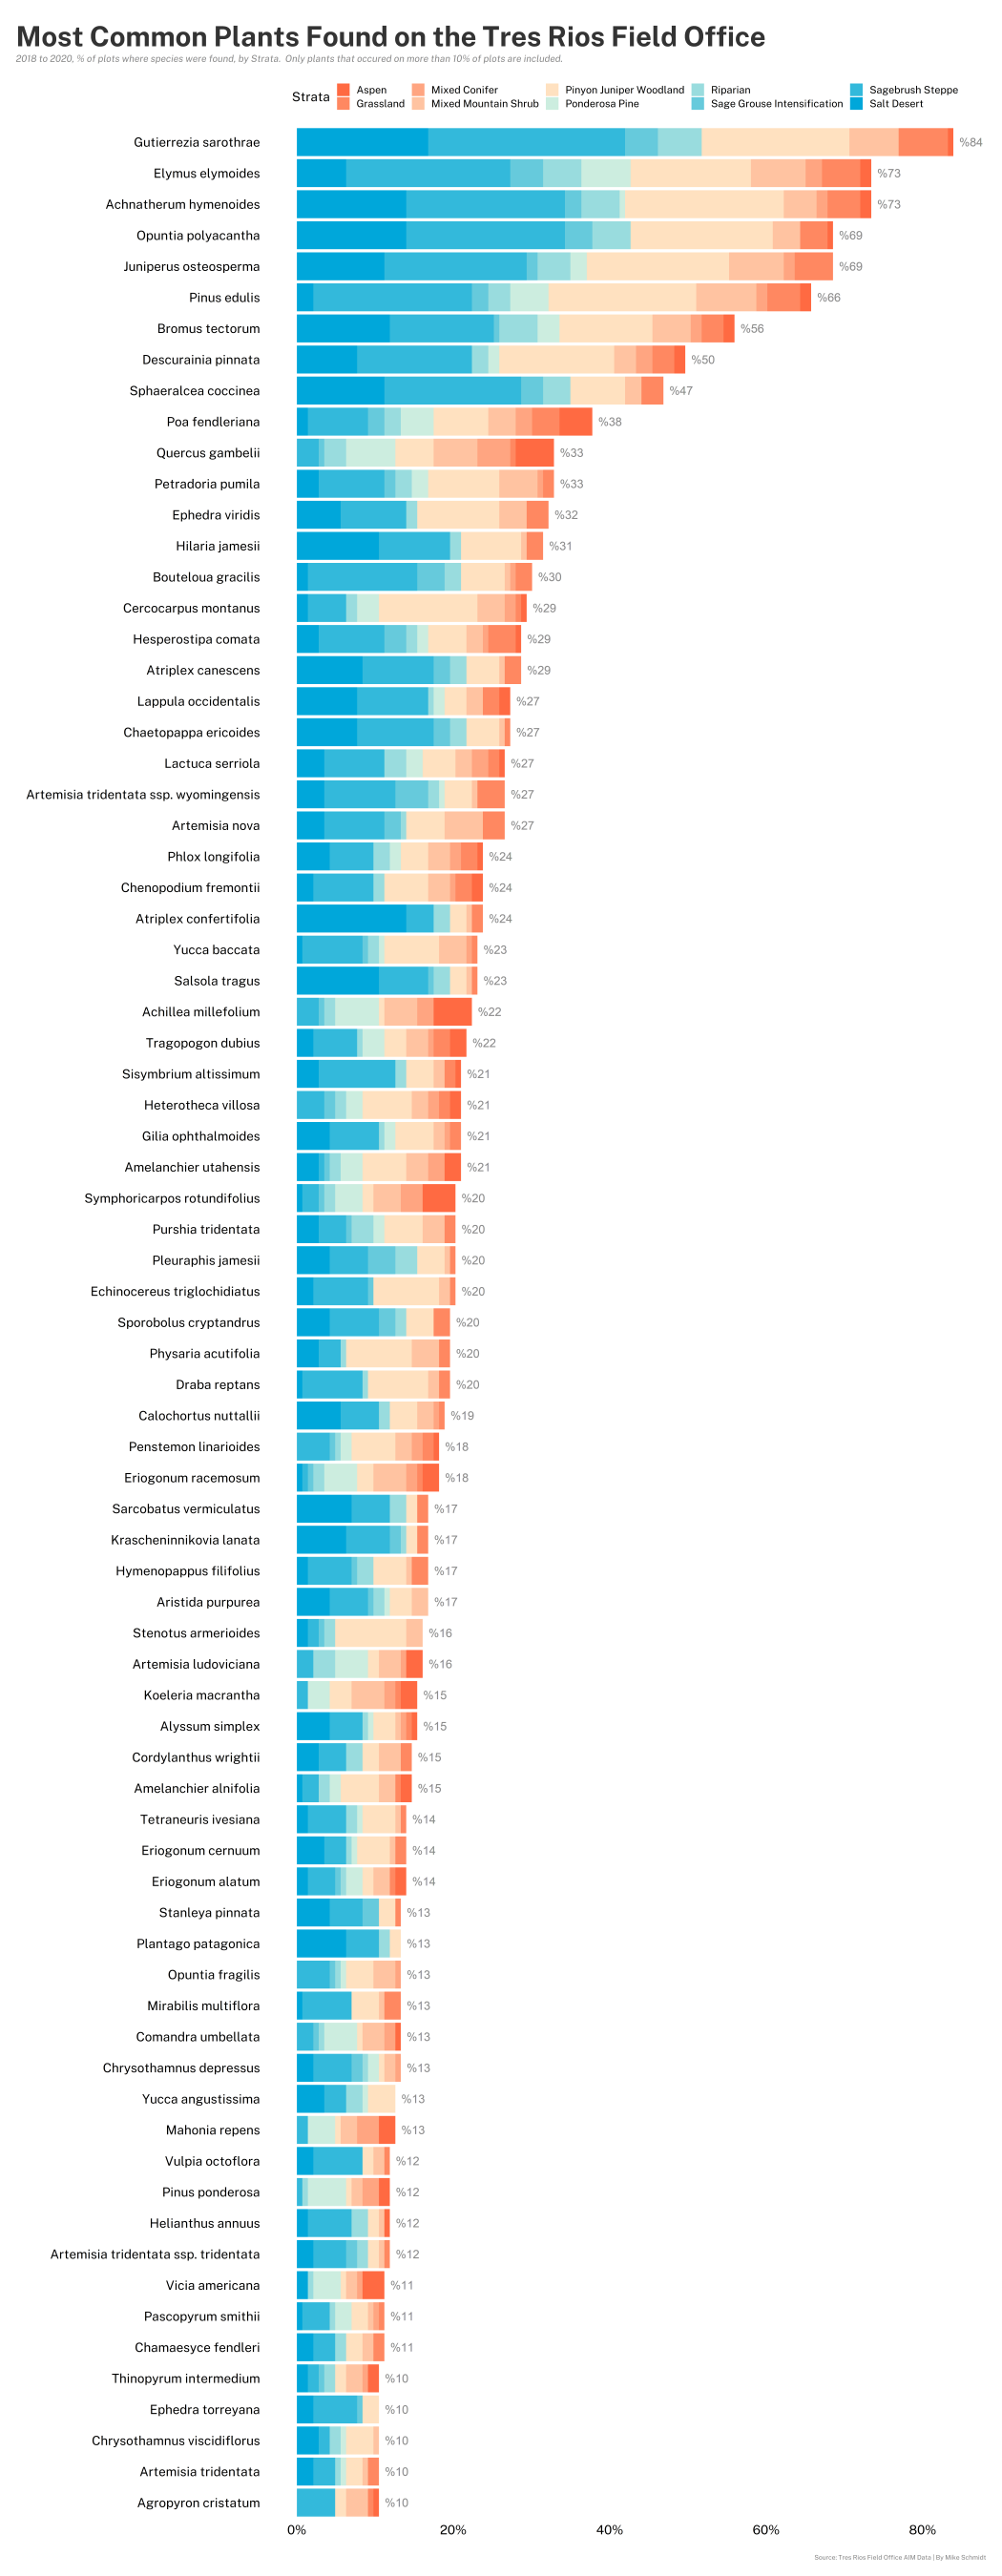
Species Richness
As part of the AIM protocol we try to identify every plant that occurs at each site. The first visualization is a column plot of the percentage of vegetation sites that a species of each plant was identified at, visualized by strata.
And the Scripts
sci_name_count%>%
  filter(prop_total>=.10 & !is.na(scientific_name))%>%
  arrange(Strata, desc(total))%>%
    ggplot()+
    geom_col(aes(scientific_name, prop_n, fill=Strata))+
    coord_flip()+
    geom_text(aes(scientific_name, prop_total, label=prop_total_text),
              color="#8C8C8C",
              size=5.25,
              hjust = -0.25
              )+
    scale_fill_manual(values = pal2)+
    scale_y_continuous(labels = scales::percent)+
    theme(
      plot.background = element_rect(fill="#FFFFFF"),
      panel.background = element_rect(fill="#FFFFFF"),
      text = element_text(size=16),
      plot.title = element_text( size=35),
      axis.text = element_text(size=16),
      legend.position="top",
      plot.title.position = "plot",
      plot.caption.position =  "plot"
    )+labs(
      title="Most Common Plants Found on the Tres Rios Field Office",
      subtitle = "2018 to 2020, % of plots where species were found, by Strata.  Only plants that occured on more than 10% of plots are included.",
      caption = "Source: Tres Rios Field Office AIM Data | By Mike Schmidt",
      x="",
      y="",
      fill="Strata"
    )+ggsave("test/output/most_abundant_plants_by_strata_large_white.png", h=45, w=17.5, type="cairo", dpi=600)
Species Richness Another Way
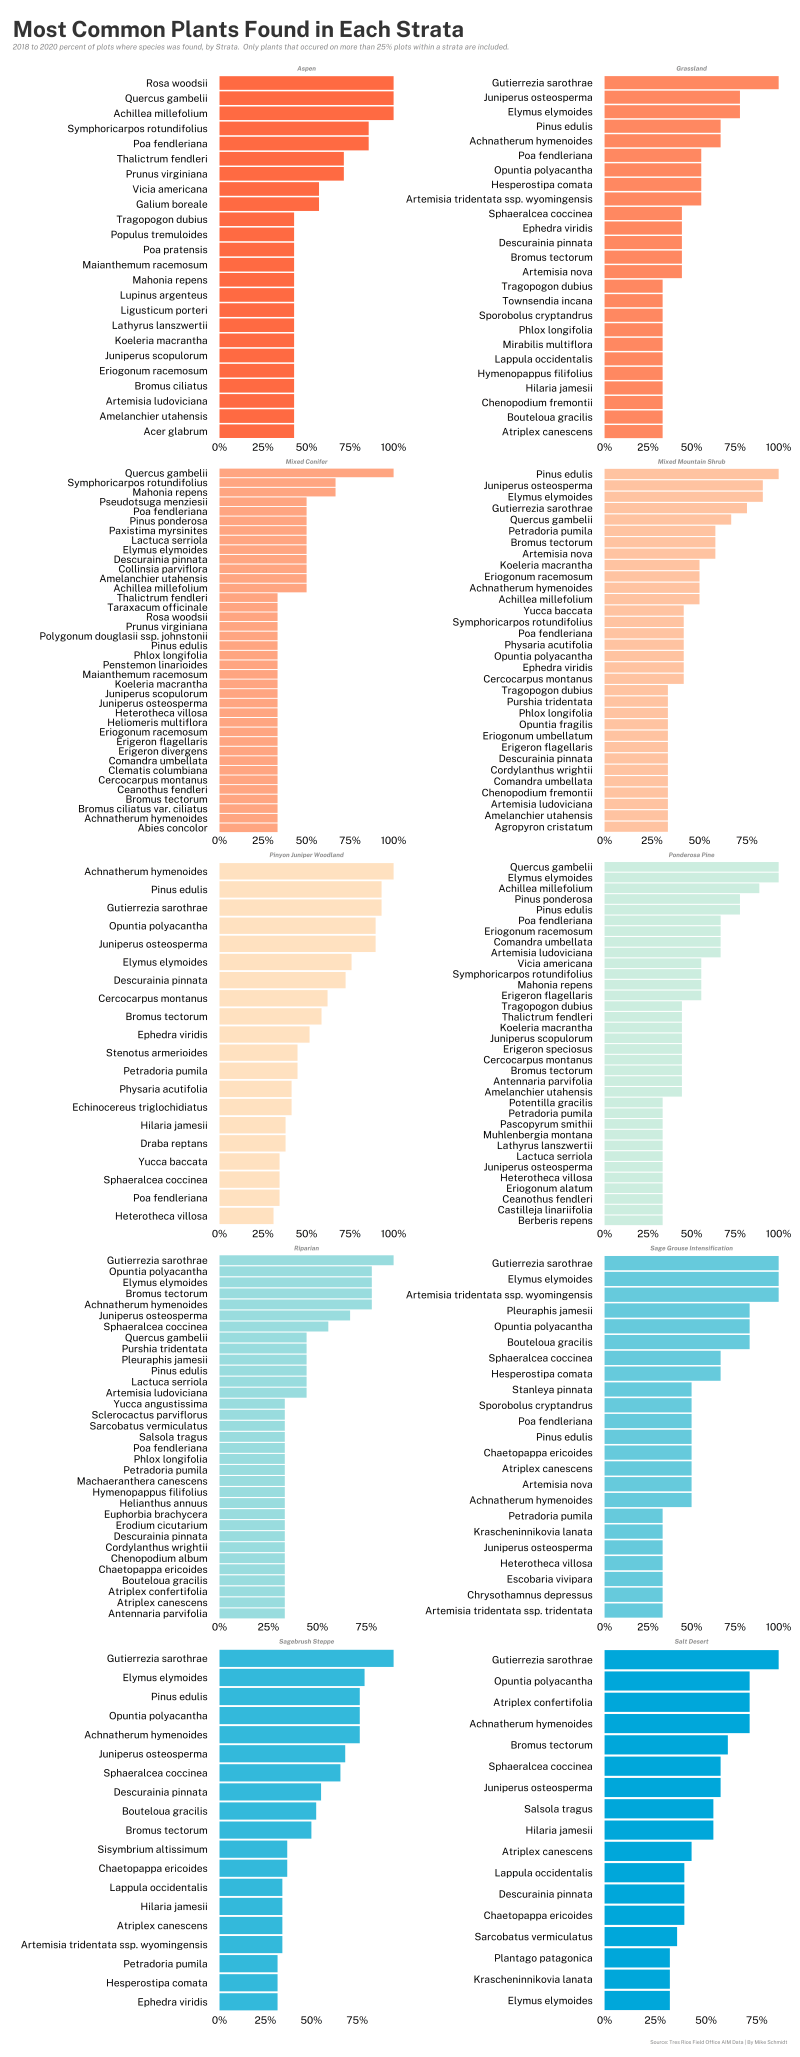
Here is the same plot but faceted by strata.
The Scripts
sci_name_count%>%
  filter(prop_strata>=.30 & !is.na(scientific_name))%>%
  mutate(
    scientific_name = as.factor(scientific_name),
    scientific_name = reorder_within(scientific_name, prop_strata, Strata)
  )%>%
  arrange(Strata, desc(total))%>%
    ggplot()+
    geom_col(aes(scientific_name, prop_strata, fill=Strata))+
    coord_flip()+
    facet_wrap(~Strata, scales = "free", ncol=2)+
    scale_fill_manual(values = pal2)+
    scale_y_continuous(labels = scales::percent)+
    scale_x_reordered()+
    theme(
      plot.background = element_rect(fill="#FFFFFF"),
      panel.background = element_rect(fill="#FFFFFF"),
      text = element_text(size=16),
      plot.title = element_text( size=35),
      axis.text = element_text(size=16),
      legend.position="none",
      plot.title.position = "plot", #NEW parameter. Apply for subtitle too.
      plot.caption.position =  "plot",
      strip.text.x = element_text(
        size = 10, color = "#8C8C8C", face = "bold.italic"
        )
    )+labs(
      title="Most Common Plants Found in Each Strata",
      subtitle = "2018 to 2020 percent of plots where species was found, by Strata.  Only plants that occured on more than 25% plots within a strata are included.",
      caption = "Source: Tres Rios Field Office AIM Data | By Mike Schmidt",
      x="",
      y="",
      fill="Strata"
    )